АЛГОРИТМ ПОИСКА КОМБИНАТОРНЫХ БИОМАРКЕРОВ, ОСНОВАННЫЙ НА ГРЕБНЕВОЙ РЕГРЕССИИ
AN ALGORITHM FOR DERIVING COMBINATORIAL BIOMARKERS BASED ON RIDGE REGRESSION
Funding
These studies were supported by Russian FASO (programme АААА-А18-118012290142-9).
Conflict of Interest
The authors declare no conflicts of interest. The authors alone are responsible for the content and writing of this article.
Maxim A. Terpilowski1*, Ekaterina A. Korf1 , Richard O. Jenkins2 , Nikolay V. Goncharov1,3
1 Sechenov Institute of Evolutionary Physiology and Biochemistry, Russian Academy of Sciences, pr. Torez 44, St. Petersburg, 194223, Russia
2 School of Allied Health Sciences, De Montfort University, The Gateway, Leicester LE1 9BH, UK
3 Research Institute of Hygiene, Occupational Pathology and Human Ecology, bld.93 Kapitolovo, Leningrad Region, 188663, Russia
*To whom correspondence should be addressed.
Associate editor: Giancarlo Castellano
Received on 24 January 2018, revised on 04 February 2018, accepted on 21 February 2018.
Abstract
Motivation: Combinatorial biomarkers are considered more specific and sensitive than single markers in medical diagnostics and prediction, yet even detection of such these combinatorial biomarkers requires deep computational analysis. The principles of analytic combinatorics, linear and kernel ridge regression, and machine learning were applied to derive new combinatorial biomarkers of muscle damage.
Results: Lactate, phosphate, and middle-chain fatty acids were most often included into biochemical combinatorial markers, while the following physiological parameters were found to be prevalent: muscle isometric strength, H-reflex length, and contraction tone. Several strongly correlated combinatorial biomarkers of muscle damage with high prediction accuracy scores were identified. The approach — based on computational methods, regression algorithms and machine learning — provides a flexible, platform independent and highly extendable means of discovery and evaluation of combinatorial biomarkers alongside current diagnostic tools.
Availability: The developed algorithm was implemented in Python programming language on a quantitative dataset comprising 23 biochemical parameters, 37 physiological parameters and 3,903 observations. The algorithm and our dataset are available free of charge on GitHub.
Supplementary information: Supplementary data are available at Journal of Bioinformatics and Genomics online.
Keywords: biomarkers, combinatorics, machine learning, bioinformatics, muscle damage.
Contact: maximtrp@gmail.com
1 Introduction
Strenuous physical activity results in increased plasma levels of pro- and anti-inflammatory cytokines, muscle creatine phosphokinase (CPK) and myoglobin (MG) (Kim et al., 2007). Increased muscle CPK activity and MG level in blood after high-endurance or high-strength exercise is a result of several factors working in combination and related to muscle damage (Nie et al., 2011; Morozov et al., 2011; Ohlendieck, 2013; Rebalka and Hawke, 2014; Burch and Glaab, 2016); it is suggested that increase in these biomarkers is strongly related to the duration, intensity of exercise and physical fitness. However, ambiguous expression patterns and measurement complexity of many biomarkers decrease their prediction value, leading to overdue diagnosis and poor prognosis. Parallel measurement of multiple “early” biomarkers would certainly increase the diagnostic accuracy. In the context of physical exercise, their determination may aid prediction of the extent of muscle damage, and selection of relevant upper limits of physical loads. Such combination of markers defines a combinatorial biomarker, the identification of which usually involves multivariable assays (such as gene expression profiling or multiplex assays) (Rakha et al., 2010). A combinatorial biomarker conveys a specific pattern that bears much more information than individual markers. The detection of these patterns requires the complex bioinformatics analysis that is necessary for all multidimensional data. Currently, it is well recognised that combinatorial biomarkers are more specific and sensitive than single markers (Goncharov et al., 2015; Voitenko et al., 2015). However, the expression of combinatorial biomarkers as well as their prognostic and predictive value needs to be well-defined. This is often challenging as even a search process presents great difficulty when it deals with a high-dimensional dataset and a huge number of parameters (Koop, 2005). The aim of the present study was to implement an algorithm to search for and evaluate combinatorial biomarkers consisting of a subset of non-invasive parameters that can be easily and early measured using a portable analyser, even in “field” conditions. In general, such an algorithm can be applied to search for hidden associations and correlations between markers that are not detected manually or by a basic correlation and linear regression analysis. The main idea behind the algorithm was to find new combinatorial biomarkers which have a strong association with a known valid biomarker and may be used for precise diagnosis and prediction. Derivation or even mining of such biomarker is a complicated process. Furthermore, manual enumeration of all possible combinations of biomarkers is counterproductive, but can be effectively done with computational methods (Kotthoff, 2016).
2 Methods
2.1 Algorithm design
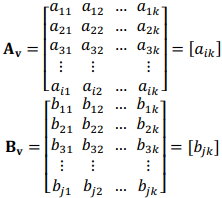
The algorithm includes four major steps. Firstly, the user imports and pre-processes data to make relevant matrices, where a row vector represents a parameter and a column vector stands for an observation. Secondly, all the necessary iterators are defined. This is an internal step done by the algorithm, but it may be modified later. It includes four basic iterators for the following types of combinatorial biomarkers (Table 1): a/b, a×b/c, a/(b×c), a×b/(c×d). Additionally, two more iterators are included for a preliminary screening: a, 1/a. Thirdly, a pool of asynchronous processes starts. Each process involves: 1) calculating combinatorial biomarkers through element-wise vector operations (multiplication and division); 2) standardisation of calculated biomarkers to minimise overfitting and normalise the scale (Buteneers et al., 2013); 3) fitting a regression model to input data and calculating a coefficient of determination R2 : currently, ordinary least squares (OLS) linear regression, linear ridge regression, Theil-Sen robust regression and kernel (nonlinear Gaussian) ridge regression are available; and 4) adding information about the estimated biomarker to Pandas DataFrame if a regression score is higher than a defined threshold (> 0.8). This part of algorithm is related to a simple single-layer perceptron.
2.2 Implementation and usage
The algorithm has been implemented in Python programming language (http://www.python.org) and depends heavily on other third-party scientific packages: NumPy, SciPy, ScikitLearn, Pandas and Matplotlib (Pérez et al., 2007; Walt et al., 2011; Pedregosa et al., 2011; Hunter, 2007; McKinney, 2010). It is flexible, platform independent, fast, well documented, and available on GitHub. It is also capable of asynchronous running on multiple cores of the modern CPUs. We endorse use of the algorithm with a Jupyter notebook and IPython kernel (https://jupyter.org) (Pérez et al., 2007). It can be easily imported by running the following command in a Jupyter notebook: import combiom. To demonstrate the usage of this algorithm, we provide our notebooks on GitHub (https://github.com/maximtrp/biomarkers).
2.3 Datasets
Quantitative data obtained in our recent experiment was used. The overall data set included 23 biochemical parameters, 37 physiological parameters and 3,903 observations. The training data set consisted of 11 biochemical (q = 11) and 15 physiological (r = 15) parameters that were estimated at various time points of the experiment (t = 8): 0 (shortly before physical activity), 1 (one hour after physical activity), 24 (one day after), 48 (two days after), 72 (3 days), 120 (5 days), 168 (7 days), and 216 (9 days). Thus, we can represent all data in a matrix form. Let 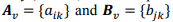 and q × t rectangular matrices of biochemical and physiological parameters, correspondingly, where v is an index of a volunteer.
Each row in a matrix represents a parameter, and each column represents a time point, where k = 8. All data were stored in CSV files, with two files for each volunteer (v = 10): one contained biochemical parameters, and the other – physiological parameters. These files were iteratively read, converted to Numpy arrays and sliced to get 1-hour measurements. Data on target markers – creatine phosphokinase (CPK), myoglobin (MG), aspartate aminotransferase (AST), and albumin – were then imported from separate CSV files. These data were normalized using log-function. Use of Numpy array objects was found to greatly improve the performance of shaping and numerical operations.
2.4 Biomarkers combinations and permutations
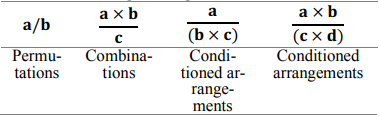
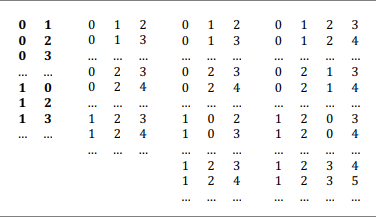
Searching through all possible combinations of markers and fitting regression models to each of them is a “brute-force” or exhaustive search approach requiring a great amount of time and machine resources. In the present research, the principles of combinatorial search and analytic combinatorics as basic heuristics was applied to the problem, which created matrices of all productive marker arrangements (Barcucci et al., 1999). This approach reduced the search space and time needed to iterate over all possible combinations (Table 1).
Table 1. Representation of combinatorial subsets of a sequence of parameters.
2.5 Regression analysis and model training
Regression analysis is used to explore and understand the forms of relationships between the independent and dependent variables. Regression analysis overlaps with the field of machine learning as a regression model that can be trained and used to predict the outcome given the input. In the present research several regression models were implemented. OLS linear regression minimizes the residual sum of squares between the observed value and the value predicted by the linear approximation:
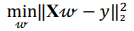
where X is a data matrix with each  , being a row,
  is a vector of regression coefficients. The algorithm performs standardisation of input data to normalise row vectors in order to prevent overfitting. Let
 be a row vector of
  time-dependent observations of an
  complex biomarker. Then, its standard score is defined as:

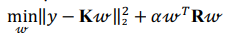
Ridge regression makes use of standard score, solving the problem of minimizing a penalized residual sum of squares:
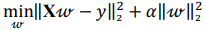
where X is a data matrix with each , being a row, is a vector of regression coefficients,  is a regularization parameter.
Kernel ridge regression combines ridge regression with a kernel function (herein, radial basis kernel function): 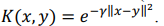
where K is a kernel matrix, R is a regularization matrix (here, K = R), is a vector of regression coefficients (weights), is a regularization parameter.
Least squares regression models are highly sensitive to outliers, which can compromise the regression results and lead to a wrong prediction. Therefore, we also added a Theil-Sen (robust) estimator to the algorithm. The algorithm relies on ScikitLearn implementation of regression models (Pedregosa et al., 2011).
2.6 Analysis and visualization
Upon completion of the analysis, the algorithm creates a Pandas DataFrame object containing the results. A user may further transform, process, analyse or export these data to multiple formats with built-in Pandas functions (including Microsoft Excel XLSX and CSV files) (Figure 1). An interface to connect a DataFrame object with input data was created. It includes several functions to predict, plot and export models; usage example are given in our Jupyter notebook.
2.7 Evaluation method
Each regression model has a scoring function which computes coefficient of determination R2 of the prediction:
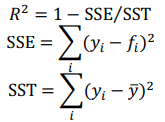
where  , are observed values,
  , are predicted values,
  t is a mean of observed values.
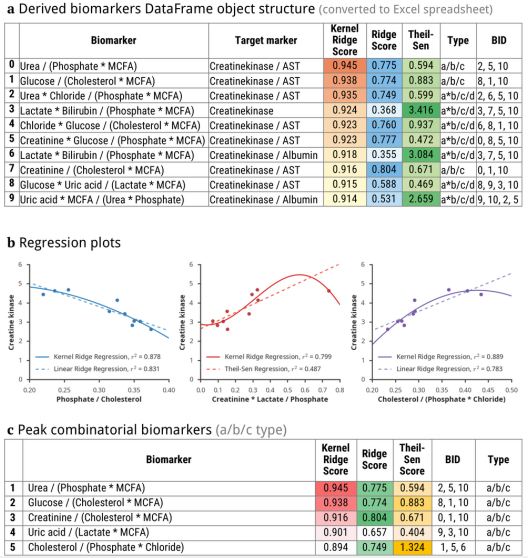
Fig. 1 - Illustration of output data: a) database structure, b) regression plots, c) a table of 3 combinatorial biomarkers (of a/b/c group) having the strongest correlations with plasma levels of creatine phosphokinase and myoglobin.
3 Results
3.1 Derived combinatorial biomarkers
We searched for combinatorial biomarkers having strong correlations and high regression scores (>0.8) with well-established markers of muscle damage (target markers): CPK, MG, and AST activity. Our dataset contained a total of 3,903 observations. This was manually reduced to 880 observations of 11 biochemical parameters and 1,200 observations of 15 physiological parameters (Table 2). The data arrays were then sliced to obtain only 1-hour measurements of parameters (one hour after physical activity) and fed to iterating functions. The algorithm scanned through a total of 19,558 potential biochemical markers and 71,960 physiological markers combinations. The output database contained 393 biochemical markers and 964 physiological markers.
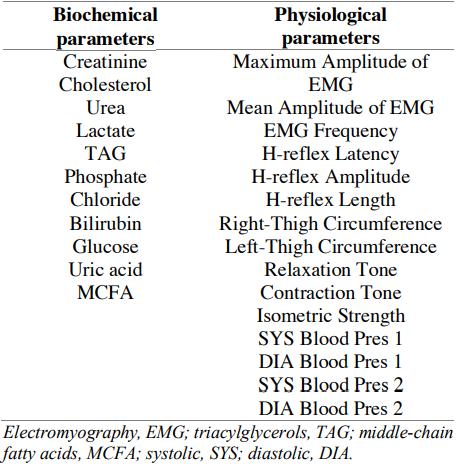
Table 2. Biochemical and physiological parameters used in an exhaustive search of combinatorial biomarkers
The results were analysed by several criteria. Firstly, we explored associations and correlations with target markers. As expected, most combinatorial biomarkers strongly correlated with CPK itself and its ratios with albumin, MG and AST (56.0% of biochemical markers and 60.2% of physiological markers). AST correlated with 17.2% of biochemical and 10.9% of physiological markers. MG was found to be associated with 26.9% biochemical and 28.8% physiological markers (Figure 2). Further analysis of these sets identified (joint and filtered) 504 biochemical and 1054 physiological biomarkers strongly associated with three or more target markers (R2≥ 0.80). Table A.1 shows the top 20 combinatorial biomarkers and their regression scores.
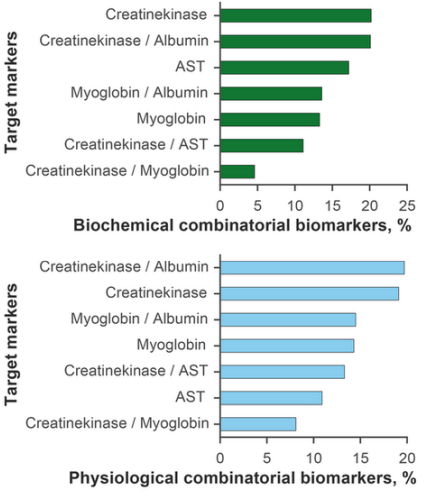
Fig. 2 - Combinatorial biomarkers obtained in an exhaustive search and grouped by target markers. Most markers correlate strongly with creatine phosphokinase / albumin and creatine phosphokinase
Several grouping and aggregating operations were also carried out on the data: single markers were grouped by number of instances in resulting combinations (Figure 3). Middle-chain fatty acids (MCFA; 40.0%), lactate (39.2%), glucose (35.3%), and were most often included into biochemical combinatorial markers. The following physiological parameters were also found to be prevalent: muscle isometric strength (33.4%), contraction tone (32.5%), and H-reflex length (29.5%).
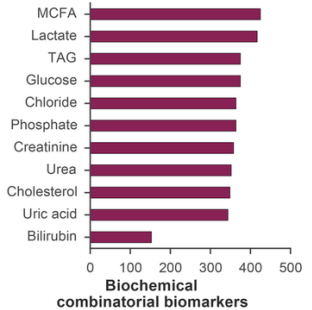
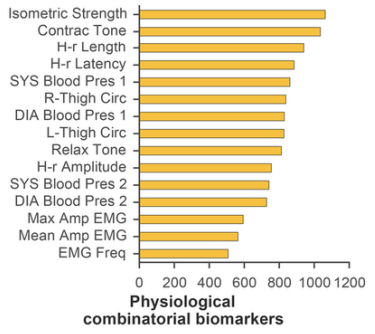
Fig. 3 - Aggregation statistics on physiological (a) and biochemical (b) parameters included into combinatorial biomarkers. MCFA and muscle isometric strength had highest instances.
3.2 Visualization and prediction
Regression models implemented in the algorithm provide prediction functions. Given the input, they quantitatively predict plasma levels of muscle CPK and MG. A model can also be retrained after obtaining new data. Fitting a model to a larger dataset will greatly improve the accuracy of predictions. Further information and examples are provided in the Jupyter notebooks.
3.3 Cross-validation
Data were split into training and test sets to see how the models perform in practice. Due to the small size of our dataset, we used a leave-1-out cross-validation (CV) method. Mean absolute deviation (MAD), mean absolute percentage error (MAPE), mean squared error (MSE) and root mean squared error (RMSE) were employed as statistical metrics to assess the quality of derived predictors:
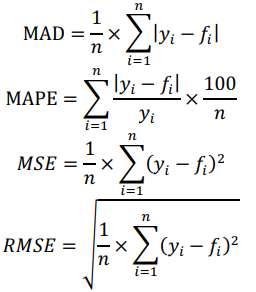
where  , are observed values,
  , are predicted values, n is a number of observations. Combinatorial markers with the highest kernel ridge scores were selected and the technique was applied to assess their prediction accuracy. The results are listed in Table A.2. Even though our dataset is not large, the found combinatorial markers provide acceptable accuracy in making predictions of muscle damage markers. Moreover, their accuracy can be increased by feeding new data to the algorithm in order to retrain the models.
3.4 Performance evaluation
We executed the algorithm on our standalone server (running ArchLinux ARM): a single-board computer ODROID C2 with Amlogic Cortex-A53 (ARMv8) 2Ghz quad core CPU and 2 GB RAM. It scanned through 91,518 possible combinations in about 12 minutes. The time complexity of the algorithm is  .
.
4 Discussion
Combinatorial biomarkers are now considered a first step towards an effective integrative approach to medical diagnostics, prediction and drug development (Koop, 2005). Such biomarkers typically consist of several single markers and require a complex integrative analysis. At the present time, computational and data-mining approaches are not widely used in this field of biomarker research (Kriete, 2006). The discovery, validation of biomarkers and systemic approaches to biomarker profiling will greatly benefit from implementing bioinformatics and computational methods to biomarkers research. In this study, we have applied the analytic combinatorics, iterative functional programming, exhaustive search, ridge regression analysis and machine learning to discover and analyse new combinatorial biomarkers strongly associated with muscle damage markers. Our previously obtained dataset was sliced to get 1-hour measurements of biochemical and physiological parameters (after 1 hour of physical activity) that can be estimated with a portable analyser under field conditions. This data was passed to the algorithm to search for combinatorial biomarkers. It scanned through 91,518 possible combinations of single markers and derived 504 biochemical and 1,054 physiological combinatorial biomarkers which have strong associations with multiple markers of muscle damage. The relationships between these markers were found to be mostly non-linear. Thus, our algorithm is capable of discovering combinatorial biomarkers that can be used to make long-term predictions of muscle damage degree. Due to the small size of our dataset, we cannot predict what the relationships between derived combinatorial biomarkers and target markers of muscle damage will be in a large dataset. It poses a limitation for generalizing our findings. Though it is still intriguing to see how these combinatorial markers will behave in other experiments and datasets. Our results provide a good basis for follow up studies. These may include the application of various regression and prediction algorithms to a problem of discovering new biomarkers in large datasets, which may include numerous hidden associations between parameters. The research indicates that using computational methods to reveal hidden correlations and patterns in high-dimensional data may facilitate establishing valid combinatorial biomarkers. Their usage is a part of an effective systems biology approach to disease diagnostics, effect prediction and drug development. In summary, searching for non-invasive biomarkers and their validating is a major challenge for disease diagnostics, toxicological and pharmacological studies. In this study, computational methods were applied to iteratively derive and analyse combinatorial biomarkers, and to find strong correlations with valid muscle damage markers: CPK, MG and AST and their ratios. Herein, we propose an algorithm capable of a combinatorial search for such biomarkers. The algorithm provided many strongly correlated combinatorial biomarkers of muscle damage with high prediction accuracy scores. Such biomarkers can be used for further validation and prediction.
Список литературы
Kim, H. J., Lee, Y. H., & Kim, C. K. (2007). Biomarkers of muscle and cartilage damage and inflammation during a 200 km run. European journal of applied physiology, 99(4), 443-447. doi: 10.1007/s00421-006-0362-y
Nie, J., Tong, T. K., George, K., Fu, F. H., Lin, H., & Shi, Q. (2011). Resting and post‐exercise serum biomarkers of cardiac and skeletal muscle damage in adolescent runners. Scandinavian journal of medicine & science in sports, 21(5), 625-629. doi: 10.1111/j.1600-0838.2010.01096.x
Morozov, V., Kalinski, M., & Peake, J. (2011). Exercise and Cellular Mechanisms of Muscle Injury. Nova Science Publications. http://eprints.qut.edu.au/59912/
Ohlendieck, K. (2013). Proteomic identification of bi-omarkers of skeletal muscle disorders. Biomarkers, 7(1), 169-186. doi: 10.2217/bmm.12.96
Rebalka, I. A., Hawke, T. J. (2014). Potential biomarkers of skeletal muscle damage. Biomarkers, 8(3), 375-378. doi: 10.2217/bmm.13.163
Burch, P. M., Glaab, W. E. (2016). Novel Translational Biomarkers of Skeletal Muscle Injury. In: Drug Discovery Toxicology: From Target Assessment to Translational Biomarkers, 407-415.
Rakha, E. A., Reis-Filho, J. S., & Ellis, I. O. (2010). Combinatorial biomarker expression in breast cancer. Breast cancer research and treatment, 120(2), 293-308. doi: 10.1007/s10549-010-0746-x
Goncharov, N. V., Ukolov, A. I., Orlova, T. I., Mig-alovskaia, E. D., & Voitenko, N. G. (2015). Metabolomics: On the way to an integration of biochemistry, analytical chemistry, and informatics. Biology Bulletin Reviews, 5(4), 296-307. doi: 10.1134/S2079086415040027
Voitenko, N. G., Garniuk, V. V., Prokofieva, D. S., & Gontcharov, N. V. (2015). On new screening biomarker to evaluate health state in personnel engaged into chemical weapons extinction. Meditsina truda i promyshlennaia ekologiia, (3), 38-42. PMID: 26036023
Koop, R. (2005). Combinatorial biomarkers: from early toxicology assays to patient population profiling. Drug discovery today, 10(11), 781-788. doi: 10.1016/S1359-6446(05)03440-9
Kotthoff, L. (2016). Algorithm selection for combinato-rial search problems: A survey. In: Data Mining and Con-straint Programming (pp. 149-190). Springer, Cham. doi: 10.1007/978-3-319-50137-6_7
Buteneers, P., Caluwaerts, K., Dambre, J., Verstraeten, D., & Schrauwen, B. (2013). Optimized parameter search for large datasets of the regularization parameter and fea-ture selection for ridge regression. Neural processing let-ters, 38(3), 403-416. doi: 10.1007/s11063-013-9279-8
Pérez, F., Granger, B. E. (2007). IPython: a system for in-teractive scientific computing. Computing in Science & Engineering, 9(3). doi: 10.1109/MCSE.2007.53
Walt, S. V. D., Colbert, S. C., & Varoquaux, G. (2011). The NumPy array: a structure for efficient numerical com-putation. Computing in Science & Engineering, 13(2), 22-30. doi: 10.1109/MCSE.2011.37
Pedregosa, F., Varoquaux, G., Gramfort, A., Michel, V., Thirion, B., Grisel, O., ... & Vanderplas, J. (2011). Scikit-learn: Machine learning in Python. Journal of Machine Learning Research, 12(Oct), 2825-2830.
Hunter, J. D. (2007). Matplotlib: A 2D graphics envi-ronment. Computing In Science & Engineering, 9(3), 90-95. doi: 10.1109/MCSE.2007.55
McKinney, W. (2010). Data structures for statistical computing in python. In: Proceedings of the 9th Python in Science Conference (Vol. 445, pp. 51-56). Austin, TX: SciPy.
Barcucci, E., Lungo, A. D., Pergola, E., & Pinzani, R. (1999). ECO: a methodology for the enumeration of com-binatorial objects. Journal of Difference Equations and Applications, 5(4-5), 435-490.
Kriete, A. (2006). Biomarkers of aging: combinatorial or systems model? Science's SAGE KE, 2006(1), pe1. doi: 10.1126/sageke.2006.1.pe1