ДВУХСТУПЕНЧАТЫЙ ПОДХОД К ОБЪЕДИНЕНИЮ ЭКСПРЕССИИ ГЕНОВ И МУТАЦИИ С КЛИНИЧЕСКИМИ ДАННЫМИ УЛУЧШАЕТ ПРОГНОЗ ВЫЖИВАЕМОСТИ ПРИ МИЕЛОДИСПЛАСТИЧЕСКИХ СИНДРОМАХ И РАКЕ ЯИЧНИКОВ
A TWO-STAGE APPROACH FOR COMBINING GENE EXPRESSION AND MUTATION WITH CLINICAL DATA IMPROVES SURVIVAL PREDICTION IN MYELODYSPLASTIC SYNDROMES AND OVARIAN CANCER
Funding
This work was supported in part by the research grants: NIH 2 R01GM069430, NSFC 81573253, NIHR03DE024198, NIH R01GM081488, NIH P60AR064172, NIH UL1TR001417, иNSF DMS‐1462990.
Conflict of Interest
None declared.
Yan Li1, Xinyan Zhang1, Tomi Akinyemiju2, Akinyemi I. Ojesina2, Jeff M. Szychowski1, Nianjun Liu1, Bo Xu3, Nengjun Yi1, *
1Department of Biostatistics, University of Alabama at Birmingham, Birmingham, AL 35294, USA,
2Department of Epidemiology, University of Alabama at Birmingham, Birmingham, AL 35294, USA,
3Department of Oncology, Southern Research Institute, Birmingham, AL 35205, USA
*To whom correspondenceshould be addressed.
Associate Editor: Giancarlo CastellanoReceived on 26 June 2016;
revised on 28 July 2016; accepted on 15 September 2016
Abstract
Motivation: Many traditional clinical prognostic factors have been known for cancer for years, but usually provide poor survival prediction. Genomic information is more easily available now which offers opportunities to build more accurate prognostic models. The challenge is how to integrate them to improve survival prediction. The common approach of jointlyanalyzing all type of covariates directly in one single model may not improve the prediction due to increased model complexity and cannot be easily applied to different datasets.
Results: We proposed a two-stage procedure to better combine different sources of information for survival prediction, and applied the two-stage procedure in two cancer datasets: myelodysplastic syndromes (MDS) and ovarian cancer. Our analysis suggests that the prediction performance of different data types are very different, andcombining clinical, gene expression and mutation data using the two-stage procedure improves survival prediction in terms of improved concordance index and reduced prediction error.
Availability: The two-stage procedure can be implemented in BhGLM packagewhich is freely available at http://www.ssg.uab.edu/bhglm/.
Supplementary information: Supplementary data are available at Journal of Bioinformatics and Genomics online.
Keywords: gene expansion, mutation, clinical data, survival prediction, myelodysplastic syndromes, ovarian cancer.
Contact: nyi@uab.edu
1. Introduction
In the past decade, genomics has had an exceptionally powerful enabling role in biomedical advances. It is now well recognized that cancer is fundamentally disease of genome. A short-term goal of Precision Medicine Initiative is to expand cancer genomics to develop better treatment and prevention methods(Chaung-Stein,2006).In order to realize this goal, we need accurate prognostic models to better predict mortality and recurrence risks.Many traditional clinical prognostic and predictive factors have been known for cancer for years, however, they usually provide poor prognosis and prediction(Barrilot et al., 2012). Therefore there is need for new prognostic and predictive factors with better reproducibility and discriminatory power. Recent advance in genome technologies has made data profiled on multiple layers of genomic activitiesmore easily available, which offers extraordinary opportunities to search for new biomarkers and build accurate prognostic and predictive models.
It has been indicated in several studies that collectively analyzing different types of genomic measurements can be more informative compared to analysis of a single type of genomic measurement(Yuan et al., 2014; Gerstung et al., 2015). However, with a high degree of interdependency among clinical andgenomic variables, the challenge is how to integrate different types of variables and derive the best combination of predictors to improve the prediction of survival outcomes. The common approach is jointly analyzing all the informationin a single Cox model using the methods for high dimension data,e.g., lasso or ridge. However, the models including all clinical and different types of genomic measurements can result in different coefficient estimates compared to models with only one type of predictors, due to the correlation between these types of variables. Therefore, the predictive values of clinical and genomic variables cannot be easily interpreted, and cannot easily be applied to other datasets(van Houwelingen and Putter,2011). Furthermore, the models simply fitting all clinical and genomic variables may not improve the prediction accuracy, because of the increased model complexity(Bøvelstad et al., 2009).
In this paper, we proposed a more efficient and easily implemented two-stage procedure to integrate different types of variables, including clinical variables, gene expression and mutation. We demonstrate the advantage of the two-stage procedure in two public datasets, Myelodysplastic syndromes (MDS)(Gerstung et al.,2015)and ovarian cancer(Cancer genome atlas research,2011), using penalized Cox regressions, namely ridge, lasso and elastic net, and Bayesian hierarchical Cox model. Our goal is to build more accurate prognostic models for MDSand ovarian cancer using the two-stage approach, and to compare the overall prediction performance of clinical model, expression model, mutation model and integrative models (clinical+expression, clinical+expression+mutation).
MDS are a heterogeneous group of clonal hematopoietic stem cell malignancies and are characterized by ineffective haematopoiesis in the bone marrow(Corey et al., 2007).The incidence of MDS increases with age and about one third of patients with MDS will develop acute myeloid leukaemia (AML). Patients with MDS usually have poor prognosis. In clinical practice, the International Prognostics Scoring System (IPSS) is commonly used todeterminethe outcome of MDS patients, but its prediction power is not satisfactory (concordance index = 0.64). Here we are interested in assessing whether there are additional, independent prognostic information contained in expression and mutation.In Gerstunget. al. (2015), the prediction power of gene expression and mutation were evaluated, but expression was analyzed using principle component methods(Gerstung et al., 2015). Even though principle component analysis is a popular high-dimension reduction method and has the advantage on data compression, it falls short when it comes to determine the true predictors and its results arehighly data dependent. Therefore its utility towards precision medicine is limited.
Ovarian cancer is the leading cause of death from gynecologic malignancies in the western world.For all types of ovarian cancer, the 5-year survival rate is 45%, but for different types, it is quite heterogeneous(Riester et al., 2014). The low survival rate in ovarian cancer isbecause of 1) most ovarian cancer patients are diagnosed at late stages due to lack of clearly identifiable symptoms in its early stages and corresponding biomarkers; 2) although most late stage ovarian cancer patients response to initial chemotherapy, cancer can relapse andeventually develop chemoresistance in subsequent chemotherapies.FIGO(International Federation of Obstetrics and Gynecology) stage is the traditional toolfor predicting overall survival, but its prediction power is very limited.Reliable molecular markers that are complementary to clinical variables are needed for better prognostic stratification of patients and individualized therapy.
2. Material and methods
2.1. Data collection and processing
For MDS, the data inGerstunget. al. (2015)(Supplementary Data 1 and 2, available at http://www.nature.com/ncomms/2015/150109/ncomms6901/full/ncomms6901.html) includingclinical information, gene expression and mutation, was used. Geneexpression data (GEO accession GSE58831) are from bone marrow CD34+ cells of patients with MDS using platform GPL570 (AffymetrixGeneChip Human Genome U133 Plus 2.0 arrays). Details of how mutation data was obtained can be found in (PAPAEMMANUILet al.2013).Clinical data are available for 142 MDS patients, where 24 of them had 0 survival time and were excluded from the analysis. The outcome of interest is acute myeloid leukaemia (AML) free survival. For clinical covariates, we used those suggested by the paper, including age, gender, peripheral blood cytopenia, haemoglobin, platelets, bone marrow blasts and ring sideroblasts.For gene expression, 124 samples have 21762 features profiled. Even though we can analyze all the 21762 features, considering that large number of genes may cause computational instability and the number of genes related to AML free survival is not expected to be too large, wefiltered the expression data using variance with cutoff 0.9 and selected 2177 genes for prediction. For mutation, there are 43 genes in the dataset.Only 18 driver genes with at least 2 patients having mutations were used for prediction. Combined clinical, gene expression and mutation data were available for 118 MDS patients. Clinical characteristics of this cohort are shown in (Table 1). Finally, missing values were imputed using the mean across samples.
Table 1. Clinical characteristics of MDS patients
| Number of patients | 118 |
| Clinical outcomes | median 668.5; range (7, 3141) |
| Follow up time (days) | |
| Outcome (alive/dead) | 78 / 40 |
| AML transformation (positive/negative) | 13 / 97 ; 8 missing |
| Clinical covariates | |
| Age | median 67; range (19,87); 2 missing |
| Gender (male/female) | 77 / 41 |
| Peripheral blood cytopenia (yes/no) | 62 / 42; 14 missing |
| Haemoglobin (g/dl) | median 9.7; range (5.4, 14.6); 4 missingmedian 9.7; range (5.4, 14.6); 4 missing |
| Platelets (×109perliter) | median 165; range (10, 1042); 4 missing |
| Bone marrow blasts | median 6.3%; range(2.5%, 62.4%); 13 missing |
| Ring sideroblasts | median 2.5%; range (2.5%, 91.8%); 13 missing |
For ovarian cancer, all data including clinical information, mRNA expression and somatic mutation were downloaded fromthe cancer genome atlas (TCGA) (http://tcga-data.nci.nih.gov/docs/publications/ov_2011) as of May 2015 using TCGA-Assembler. Expression measurements were combined from three platforms: Agilent, AffymetrixHuEx and Affymetrix U133A. We used the processed level 3 (log2 lowess normalized (cy5/cy3) collapsed by gene symbol) expression data.For mutation, massive parallel sequencing was performed on the Illumina GAIIx platform or ABI SOLiD 3 platform. Details about expression and mutation data can be found in (Cancer Genome Atlas Research 2011). 598 ovarian cancer patients have clinical data.The outcome of interest is overall survival. 194 patients with overall survival time missing or equal to 0 were removed. Race, age, tumor grade, residual largest nodule, anatomic neoplasm subdivision and clinical stage were selected as the clinical covariates and there are no missing values. For gene expression, 594 samples have 12042 features profiled (no missing values). We filtered the expression data using variance with cutoff 0.8 and selected 2409 genes for survival analysis. Mutation data has 463 samples with 12446 features profiled (no missing values).99 genes for which at least 10 patients have mutations were kept for survival analysis. Combined clinical, expression and mutation data were available for 335 patients. Summary of the clinical information for these 335 ovarian cancer patients are provided in (Table 2). Finally, all the covariates were standardized (categorical variables were only centered).
Table 2.Clinical characteristics of ovarian cancer patients
| Number of patients | 335 |
| Clinical outcomes | |
| Overall survival (days) | median 928; range (36, 3953) |
| Outcome (alive/dead) | 158 / 177 |
| Clinical covariates | |
| Age | median 57; range (26, 89) |
| Race (White / Non-white) | 305 / 30 |
| Cancer stage | |
| Stage I & II | 19 |
| Stage III | 266 |
| Stage IV | 50 |
| Tumor grade | |
| G1 & G2 | 44 |
| G3 & G4 | 283 |
| GX | 8 |
| Residual disease largest nodule | |
| < 1 mm | 83 |
| 1 -10 mm | 171 |
| 11 -20 mm | 60 |
| > 20 mm | 60 |
| Anatomic neoplasm subdivision | |
| Bilateral | 253 |
| Left | 43 |
| Right | 39 |
| First course treatment outcome | |
| Complete remission | 237 |
| Partial remission | 36 |
| Progressive | 32 |
| Stable | 30 |
2.2. Statistical methods for building prediction models
Cox regression is the commonly used method for analyzing censored survival data(van Houwelinggen and Putter, 2012), for which the hazard function of survival time T takes the form 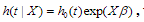 where is the baseline hazard function, X and
  are the vectors of predictors and coefficients, respectively, and Х
 is the linear predictor or called the prognostic index. The coefficients are estimated by maximizing thepartial log-likelihood:
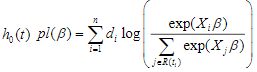
where the censoring indicator di takes 1 if the observed survival time ti for individual i is uncensored and 0 if it is censored, and  is the risk set at time
  .For expression and mutation data, the number of variables is much larger than the number of individuals and covariates are usually correlated, where Cox regression is not directly applicable.
2.3. Ridge, lasso and elastic-net Cox models
The elastic net is a widely used penalization approach to handle high-dimensional models, which adds the elastic-net penalty to the log-likelihood function and estimates the parameters by maximizing the penalized log-likelihood(Zou and Hastie, 2005a; Hastie et al., 2009; Friedman et al., 2010; Simon et al., 2011; Hastie et al., 2015). Forthe Cox models described above, we estimate the parameters by maximizing the penalized partial log-likelihood:
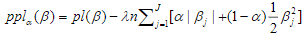
where  is a predetermined elastic-net parameter,
  is a penalty parameter, and
  is the partial log-likelihood of the Cox model. The penalty parameter
  controls the overall strength of penalty and the size of the coefficients; for a small
  , many coefficients can be large, and for a large
  , many coefficients will be shrunk towards zero. The elastic net includes the lasso
  and ridge Cox regression
  as special cases. A remarkable property of the lasso is that many coefficients can be shrunk exactly to zero, thus automatically achieving variable selection. But if a group of predictors are highly correlated, lasso tends to pick only one of them and shrink others to zero, therefore it’s not good for group selection. Ridge regression shrinks all coefficients towards zero, but will retain all the predictors and therefore can not be used for variable selection. Elastic net is able to handle “group effect”, where highly correlated predictors tend to be in or out of the model together. And it is usually more useful than lasso when p>>n, while enjoying a similar sparsity of representation (Zou and Hastie, 2005b) .
The ridge, lasso and elastic net Cox models can be fitted by the cyclic coordinate descent algorithm, which successively optimizes the penalized log-likelihood over each parameter with others fixed and cycles repeatedly until convergence. The cyclic coordinate descent algorithm has been implemented in the R package glmnet. The package glmnet can quickly fit the elastic-net Cox models over a grid of values of covering the entire range, giving a sequence of models for users to choose from. Cross-validation is the most widely used method to select an optimal value (e.g., an optimal Cox model) that gives minimum cross-validated error.
2.4.Bayesian hierarchical Cox model
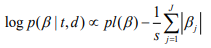
Hierarchical model is an efficient approach to handling high-dimensional data, where the regression coefficients are themselves modeled (Gelman and Hill, 2007; Gelman et al., 2014). Hierarchical models are more easily interpreted and handled in the Bayesian framework where the distribution of the coefficient is the prior distribution, and statistical inference is based on the posterior estimation. The commonly used prior is the double-exponential (or Laplace) prior distribution (Park and Casella, 2008; Yi and Xu, 2008; Yi and Ma, 2012):
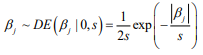
where the scale sis shrinkage parameter and controls the amount of shrinkage; a smaller scale s induces stronger shrinkage and thus forces the estimates of  towards the prior mean zero. The hierarchical Cox model with the double-exponential prior performs similarly as lasso, and the log posterior distribution of the parameters can be expressed as
We fit the hierarchical Cox model by finding the posterior modes of the parameters, i.e., estimating the parameters by maximizing the log posterior distribution. We have developed an algorithm for fitting the hierarchical Cox model by incorporating an EM procedure into the usual Newton-Raphson algorithm for fitting classical Cox models. Our algorithm has been implemented in R package BhGLM (Hochberg and Tamhane, 1987).
2.5.Two-stage approach for integrating clinical, gene expression and mutation variables
To evaluate whether expression and mutation can help improve the prediction, the usual approach is to combine different types of data directly in a single prediction model (Bovelstad et al., 2009). However, due to the correlation between clinical, expression and mutation variables, fitting a single model including all three types of variables can lead to dramatic changes in coefficient estimates and the selection of expression and mutation predictors, and may not improve the prediction performance with the increased model complexity.
Here we develop an alternative approach, i.e., a two-stage procedure, inspired by the super learner of van der Laan et al. (2007) (van Houwelingen and Putter, 2011; van Houwelinggen and Putter, 2012). A flowchart for the twostage procedure using ovarian cancer as an example is shown in (Figure 1). In the first stage, we separately fit clinical, expression and mutation covariates (model (a), (b), (c)) using ridge, lasso, elastic net and Bayesian hierarchical Cox models. For lasso, ridge and elastic net models, we used 10- fold cross-validation to select λ. Since different crossvalidation partition can result in different estimates of λ, we repeated 10-fold cross-validation 10 times and used their mean as the optimal λ. For Bayesian hierarchical models, we used  for expression and mutation, and s=1 for clinical model as the scale of the double exponential prior, where λ was the optimal λ in lasso Cox regression. Then we used the optimal λ or s to refit the corresponding model and performed 10-fold cross-validation 10 times to get an averaged cross-validated prognostic index (PICV). In the second stage, PICV for different types of predictors are handled as new covariates and used for building integrative models. We fit the integrative models I and II using PICV from clinical, expression and mutation models. Since the prognostic indices summarized all the prognostic information of clinical, expression and mutation data, the integrative model can efficiently integrate multiple sources of information to the prediction.
Denote Clinical covariates as Z, Expression information as X, Mutation information as Y, we have the following models:
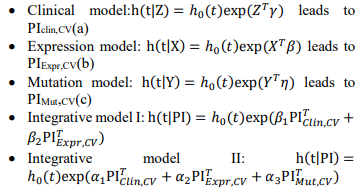
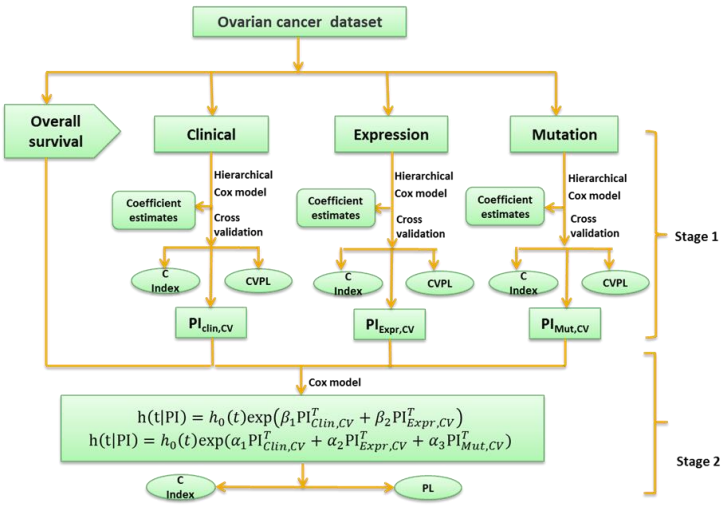
Fig. 1 – Flowchart of the two-stage procedure
2.6.Evaluating the predictive performance
To assess the prognostic utility of the fitted model, we need to evaluate the quality of the fitted model and its predictive value. There are several ways to measure the performance of a Cox model (Steyerberg, 2009; van Houwelinggen and Putter, 2012) : 1)Partial likelihood: For a Cox model, the partial likelihood can be used as an overall measure. Smaller partial likelihood corresponds to better model fit; 2) Survival curves: An important way to show the usefulness of a survival model is to depict the survival curves for different groups of the patients based on the prognostic index. The usefulness of a survival model can then be assessed by the apparent differences (e.g., log-rank test) between the survival curves; 3) Concordance index (Cindex): The C-index measures the discriminative ability of a survival model, which is similar to the Area under the ROC Curve (AUC) for logistic regression (Harrell et al., 1996; van Houwelinggen and Putter, 2012). Larger C-index corresponds to better prediction and C-index ≤ 0.5 means no predictive ability; 4) Prediction error: Measuring prediction error is an important way to evaluate predictive performance of a survival model. The most popular measurement for prediction error is the Brier score, which is defined as 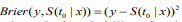 , where
  is the estimated survival probability of an individual beyond t0 given the predictor x (van Houwelinggen and Putter, 2012). Cross-validation is a standard way to evaluate the predictive performance of a model. For a K-fold crossvalidation (usually K = 10) (Hastie et al., 2009), we randomly split the data to K subsets of roughly the same size, and use (K – 1) subsets (the training data) to fit a model and then assess the performance of the fitted model on the remaining part, the k-th subset of the data (the test data). We used the pre-validation method, a variant of cross-validation (Tibshirani and Efron, 2002; Hastie et al., 2015). Denote the estimates of coefficients from the data excluding the k-th subset by
  . We calculated the prognostic index
  for all individuals in the k-th subset of the data, which is called the cross-validated or pre-validated prognostic index. Cycling through K parts, we obtained the cross-validated prognostic index
  for all individuals. We then calculated the four measures described in the last paragraph using the cross-validated prognostic index, yielding the cross-validated versions of model performance measures (Steyerberg, 2009; van Houwelinggen and Putter, 2012) .This procedure provides valid assessment of the predictive performance of a model (Tibshirani and Efron, 2002; Hastie et al., 2015). In order to obtain truly stable results, we repeated the cross-validation procedure 10 times, and used their average values.
3. Results
We first analyzed each type of predictors (i.e., clinical, gene expression and somatic mutation) separately for MDS and ovarian cancer, using three penalized Cox models (ridge, lasso and elastic net with α = 0.5) and Bayesian hierarchical Cox model. We then combined their cross-validated prognostic indices to build integrative prognostic models. (Table 3) and (Table 4) show the cross-validated C-index and cross-validated partial likelihood (CVPL) for each type of predictors, respectively. For MDS under the elastic net model, gene expression had the best prediction performance (C-index:0.71; CVPL: -212.3),which was moderately better than clinical covariates (C-index: 0.69; CVPL: -206.8) and considerably better than mutation (C-index: 0.59; CVPL: - 219.2). The trend was similar under lasso and Bayesian hierarchical model, but under ridge model, clinical covariates had a higher C-index (0.68) than expression (0.65) and mutation (0.59).
Table 3. Cross-validated C-index of ridge, elastic net, lasso and Bayesian hierarchical Cox models
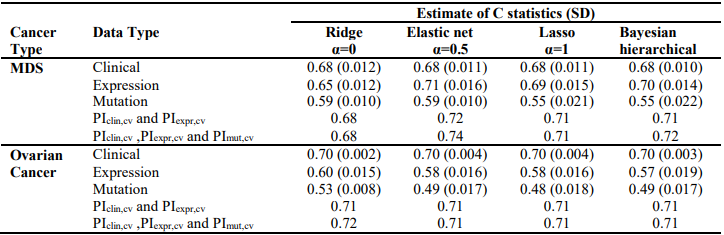
Table 4. – Cross-validated partial likelihood (CVPL) of ridge, elastic net, lasso and Bayesian hierarchical Cox models
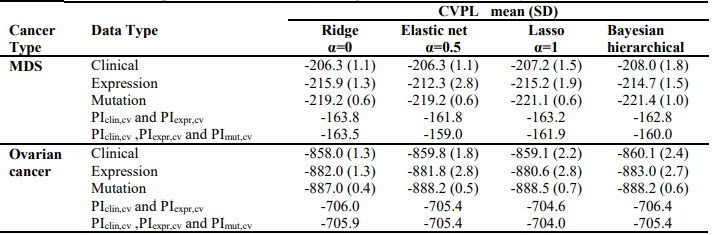
For ovarian cancer, under all the Cox models, clinical data always had the best prediction performance (C-index: 0.70; CVPL: around -859), expression came second (Cindex: around 0.58; CVPL: around -882)and mutation was the worst (C-index: around 0.49; CVPL: around -888). For expression and mutation, ridge Cox model tends to perform better than other models (C-index: 0.60 for expression and 0.53 for mutation).Similar to MDS mutation, ovarian cancer mutation data had the worst prediction performance regardless of which Cox model was used.
The lasso, elastic net, and Bayesian hierarchical Cox models not only provide prediction but also identify prognostic variables. The coefficients estimates of lasso and Bayesian hierarchical models were shown in supplementary. Then we combined the PICV of clinical, expression and mutation models to build integrative prognostic models using the two-stage procedure (integrative model I and II). It can be seen from (Table 3) and (Table 4), for both MDS and ovarian cancer, integrative model I improved the predictive accuracy in terms of both C-index and CVPL. The prediction performance of the integrative model II was very similar to that of the integrative model I, indicating mutation did not add independent prognostic information. Since the integrative model I and II perform similarly under different Cox model, we only discuss the results of Bayesian hierarchical models in the following section. For MDS, the C-index and CVPL for the integrative model I and II were 0.71 and -162.8, 0.72 and -160.0 respectively, which were moderately better than the expression only model (C-index 0.70, CVPL -214.7). Similarly, for ovarian, the integrative model I and II improved the prediction (C-index 0.71 and CVPL -706.4 for integrative model vs C-index 0.70 and CVPL -860.1 for clinical only model). For both MDS and ovarian cancer under other Cox models, the integrative model I and II were also moderately better than any of the models based on single type of predictors.
Finally, the predictive performance of these Cox models was assessed by prediction error using Brier scores from the Bayesian hierarchical Cox models. It can be seen from (Figure 2) that for both MDS and ovarian cancer, the integrative model I and II had smaller prediction errors compared to any of the models based on single type of predictors. To show the predictive usefulness of the integrative models, patients were divided into two subgroups by the median of the PIcv from the Bayesian hierarchical Cox model. The Kaphlan-Meier survival curves for MDS and ovarian cancer were shown in (Figure 3) and (Figure 4), respectively. For both MDS and ovarian cancer, the integrative models resulted in larger difference between curves, and thus produce more predictable survival, even though the improvement was not spectacular compared with models with only expression or clinical covariates.
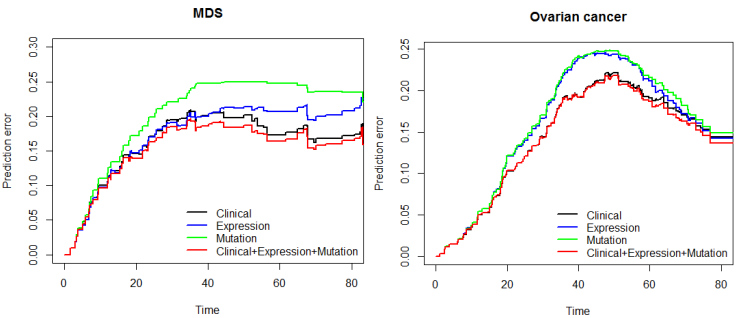
Fig. 2 – Brier prediction errorcurves for MDS and ovarian cancer
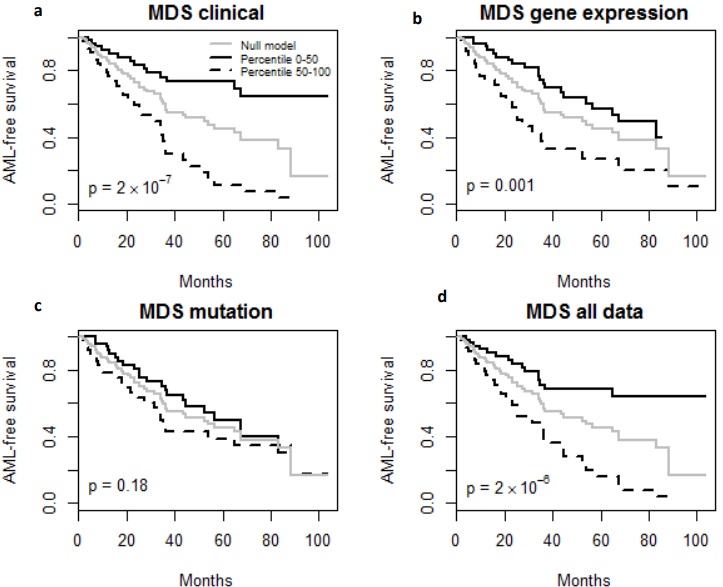
Fig. 3 – Kaplan-Meier Survival Curves. (a-d) Kaplan-Meier survival curves for patients predicted to have above or below median risk of death due to MDS. P-values are from log rank test.
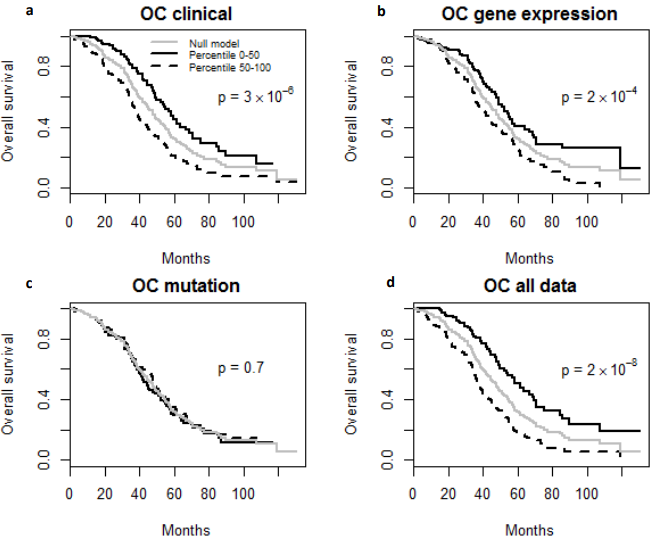
Fig. 4 – Kaplan-Meier Survival Curves. (a-d) Kaplan-Meier survival curves for patients predicted to have above or below median risk of death due to ovarian cancer (OC). P-values are from log rank test.
4. Discussion
In this article we propose a two-stage procedure that addresses the challenge of effectively integrating different levels of genomic measurements with clinical data for improving survival outcome. Instead of simply jointly analyzing all types of data in one model, the two-stage procedure builds an integrative model using the cross validated prognostic index obtained from individual models. The two-stage procedure is easy to implement and provides an unbiased view of the contributions of different types of data to the prediction model. Our analyses of MDS and ovarian cancer data show that jointly fitting PIcv from clinical, gene expression and mutation models improved the prediction of survival outcome, in terms of increased Cindex and CVPL, and reduced prediction error, compared to models with only traditional clinical factors. However, the improvement is not dramatic, with the major contribution from either clinical predictors or expression. This suggests that the information shared by clinical predictors, expression and mutation contains more prognostic information than independent components.
Among the genes that we identified in this study (as shown in appendix), some have already been reported to be associated with MDS or ovarian cancer, while others have not. For MDS expression, 13 genes (TM4SF1, MX2, PTP4A3, C1ORF191, NCRNA00230A, AMT, FAM184B, TTTY14, GJA1, CD93, RPS10, EIF1AY, PTH2R) were selected by all the models. PTP4A3 has been identified as a negative prognostic indicator in human AML (Beekman et al., 2011). GJA1 is the target of RUNX1 which is highly significantly mutated in AML and leukemic translocations that involve RUNX1 (Matsuura et al., 2012). CD93 expression is functionally required for engraftment of primary human AML leukemia stem cells (LSCs) and leukemogenesis, and it regulates LSCs self-renewal predominantly by silencing CDKN2B, a major tumor suppressor in AML (Iwasaki et al., 2015). RPS10 was found rarely mutated in Diamond-Blackfan anemia patients and they have a higher-than-average chance of developing MDS (Doherty et al. 2010). Over expression of PTH2R has found to be associated with reduced overall survival in MDS patients (Zeidan et al., 2014).No study has found the association between MDS and the rest of the genes yet. For ovarian cancer expression, 17 genes (PRAME, FJX1, RAB11FIP1, HSPA1A, IFRD1, CST6, GBP2, NLRP2, FLNA, PRSS16, PART1, PPM2C, BLMH, SDF2L1, PEX6, GJB1, NARS2) were selected by all the models. PRAME has been indicated as a prognostic factor in stage III serious ovarian adenocarcinomas (Partheen et al., 2006; Partheen et al., 2008). FJX1 was detected in vascular structures in ovarian cancer samples, it expresses at very low levels in normal ovarian vasculature (Buckanovich et al., 2007). RAB11FIP1, which encodes a protein with ras-activating function, has been frequently amplified in breast cancer (Zhang et al., 2009). It has also been shown that RAB11FIP1 (also known as Rab-coupling protein) can enhance invasive migration of cancer cells into fibronectin-rich 3D ECM by endocytic recycling of α5β1 integrin (Jacquemet et al., 2013; Paul et al., 2015). There is no report on the association between the rests of genes selected with ovarian cancer so far. The genes we identified could give us more insight into the molecular mechanisms of the disease. They could also be potential targets for new treatment, or potential signature for improving prognostic power. The specific role of those genes still needs to be validated by biological experiments.
Our study suggests that the prediction power of clinical information, expression and mutation varies in different types of cancer. For MDS, gene expression tends to slightly outperform clinical data, while for ovarian cancer clinical factors have higher prediction power than gene expression. The prediction power of mutation is relatively low in both MDS and ovarian cancer. These findings are consistent with results from previous studies where features measured at transcription level tends to contain more prognostic information than features measured at DNA/epigenetic level. From a biologic point of view, this is reasonable because features measured at DNA/epigenetic level affect clinical outcome through its effect on expression and most of the meaningful information in mutation will be captured by expression. On the other hand, there are still many other types of cancer that we need to explore and it’s possible that for some cancer types, mutation still have prognostic utility. Therefore, new methods are still in need to more efficiently extract information from mutation data.
It can also be noted that the results are method dependent. For example, ridge regression was the least favorable method for MDS expression, but was the best method for ovarian cancer expression. Lasso, elastic net and Bayesian Hierarchical model tends to have similarly results. In practice, it is impossible to know the underlying structure of the data and which method is the most appropriate. But a thorough understanding of the advantage and disadvantage of different methods can help narrow down the list. And it may be necessary to compare different methods to choose the one that can best extract the prognostic information. In this study, only clinical, expression and mutation were used for prediction. TCGA also provides other levels of genetic data, e.g. DNA methylation, miRNA and copy number alterations, for more than 30 types of cancer. Therefore one future direction is to apply the two stage procedure to other types of data and cancer, and further evaluate the utility of the two-stage procedure.
Список литературы
Hastie, T., Tibshirani, R., & Friedman, J. The elements of statistical learning.
Hastle, T., Tibshirani, R., & Wainwright, M. (2015). Statistical learning with sparsity. Boca Raton: CRC Press.
Hochberg, Y. & Tamhane, A. (1987). Multiple comparison procedures. New York: Wiley.
Iwasaki, M., Liedtke, M., Gentles, A., & Cleary, M. (2015). CD93 Marks a Non-Quiescent Human Leukemia Stem Cell Population and Is Required for Development of MLL-Rearranged Acute Myeloid Leukemia. Cell Stem Cell, 17(4), 412-421. http://dx.doi.org/10.1016/j.stem.2015.08.008
Jacquemet, G., Green, D., Bridgewater, R., von Kriegsheim, A., Humphries, M., Norman, J., & Caswell, P. (2013). RCP-driven α5β1 recycling suppresses Rac and promotes RhoA activity via the RacGAP1–IQGAP1 complex. J Cell Biol, 202(6), 917-935. http://dx.doi.org/10.1083/jcb.201302041
Matsuura, S., Komeno, Y., Stevenson, K., Biggs, J., Lam, K., & Tang, T. et al. (2012). Expression of the runt homology domain of RUNX1 disrupts homeostasis of hematopoietic stem cells and induces progression to myelodysplastic syndrome. Blood, 120(19), 4028-4037. http://dx.doi.org/10.1182/blood-2012-01-404533
Network, T. (2012). Erratum: Integrated genomic analyses of ovarian carcinoma. Nature, 490(7419), 292-292. http://dx.doi.org/10.1038/nature11453
Papaemmanuil, E., Gerstung, M., Malcovati, L., Tauro, S., Gundem, G., & Van Loo, P. et al. (2013). Clinical and biological implications of driver mutations in myelodysplastic syndromes. Blood, 122(22), 3616-3627. http://dx.doi.org/10.1182/blood-2013-08-518886
Houwelingen, J. & Putter, H. (2012). Dynamic prediction in clinical survival analysis. Boca Raton: CRC Press.
Park, T. & Casella, G. (2008). The Bayesian Lasso. Journal Of The American Statistical Association, 103(482), 681-686. http://dx.doi.org/10.1198/016214508000000337
Partheen, K., Levan, K., Österberg, L., & Horvath, G. (2006). Expression analysis of stage III serous ovarian adenocarcinoma distinguishes a sub-group of survivors. European Journal Of Cancer, 42(16), 2846-2854. http://dx.doi.org/10.1016/j.ejca.2006.06.026Partheen, K., Levan, K., Österberg, L., & Horvath, G. (2006). Expression analysis of stage III serous ovarian adenocarcinoma distinguishes a sub-group of survivors. European Journal Of Cancer, 42(16), 2846-2854. http://dx.doi.org/10.1016/j.ejca.2006.06.026
Partheen, K., Levan, K., Österberg, L., Claesson, I., Fallenius, G., Sundfeldt, K., & Horvath, G. (2008). Four potential biomarkers as prognostic factors in stage III serous ovarian adenocarcinomas. International Journal Of Cancer, 123(9), 2130-2137. http://dx.doi.org/10.1002/ijc.23758
Paul, N., Allen, J., Chapman, A., Morlan-Mairal, M., Zindy, E., & Jacquemet, G. et al. (2015). α5β1 integrin recycling promotes Arp2/3-independent cancer cell invasion via the formin FHOD3. The Journal Of Experimental Medicine, 212(10), 21210OIA78. http://dx.doi.org/10.1084/jem.21210oia78
Riester, M., Wei, W., Waldron, L., Culhane, A., Trippa, L., & Oliva, E. et al. (2014). Risk Prediction for Late-Stage Ovarian Cancer by Meta-analysis of 1525 Patient Samples. JNCI Journal Of The National Cancer Institute, 106(5), dju048-dju048. http://dx.doi.org/10.1093/jnci/dju048
Simon, N., Friedman, J., Hastie, T., & Tibshirani, R. (2011). Regularization Paths for Cox's Proportional Hazards Model via Coordinate Descent. Journal Of Statistical Software, 39(5). http://dx.doi.org/10.18637/jss.v039.i05
Steyerberg, E. (2009). Clinical prediction models. New York: Springer.
Tibshirani, R. & Efron, B. (2002). Pre-validation and inference in microarrays. Statistical Applications In Genetics And Molecular Biology, 1(1). http://dx.doi.org/10.2202/1544-6115.1000
Yi, N. & Ma, S. (2012). Hierarchical Shrinkage Priors and Model Fitting for High-dimensional Generalized Linear Models. Statistical Applications In Genetics And Molecular Biology, 11(6). http://dx.doi.org/10.1515/1544-6115.1803Yi, N. & Ma, S. (2012). Hierarchical Shrinkage Priors and Model Fitting for High-dimensional Generalized Linear Models. Statistical Applications In Genetics And Molecular Biology, 11(6). http://dx.doi.org/10.1515/1544-6115.1803
Yi, N. & Xu, S. (2008). Bayesian LASSO for Quantitative Trait Loci Mapping. Genetics, 179(2), 1045-1055. http://dx.doi.org/10.1534/genetics.107.085589
Yuan, Y., Van Allen, E., Omberg, L., Wagle, N., Amin-Mansour, A., & Sokolov, A. et al. (2014). Assessing the clinical utility of cancer genomic and proteomic data across tumor types. Nature Biotechnology, 32(7), 644-652. http://dx.doi.org/10.1038/nbt.2940
Zeidan, A., Prebet, T., Saad Aldin, E., & Gore, S. (2014). Risk stratification in myelodysplastic syndromes: is there a role for gene expression profiling?. Expert Review Of Hematology, 7(2), 191-194. http://dx.doi.org/10.1586/17474086.2014.891437
Zhang, J., Liu, X., Datta, A., Govindarajan, K., Tam, W., & Han, J. et al. (2009). RCP is a human breast cancer–promoting gene with Ras-activating function. Journal Of Clinical Investigation. http://dx.doi.org/10.1172/jci37622
Zou, H. & Hastie, T. (2005). Regularization and variable selection via the elastic net. Journal Of The Royal Statistical Society: Series B (Statistical Methodology), 67(2), 301-320. http://dx.doi.org/10.1111/j.1467-9868.2005.00503.x