BEKVAEM: ИНТЕГРИРОВАННЫЙ ОБОЗРЕВАТЕЛЬ ДАННЫХ ДЛЯ HI-C DATA
DOI: https://doi.org/10.18454/jbg.2019.2.11.1
Hofmann A.*1, Müggenburg J.2, Crémazy F.3, Heermann D.W.4
1, 2, 4 Institute for Theoretical Physics, Heidelberg University, Heidelberg, Germany
3 University of Versailles Saint-Quentin-en-Yvelines, Montigny-le-Bretonneux, France
* Correspodning author (Andreas.Hofmann@thphys.uni-heidelberg.de)
Received: 13.09.2019; Accepted: 22.09.2019; Published: 27.09.2019
BEKVAEM: INTEGRATIVE DATA EXPLORER FOR HI-C DATA
Application Notes
Abstract
Motivation: The browser-based visualization of Hi-C contact maps alongside complementary data tracks is a computationally challenging task and requires an efficient software implementation to run on small clients. Few software packages have yet been shared with the community to address this problem and modification of these is cumbersome. Results: We introduce Bekvaem that addresses these problems by using high-level Python interfaces. Wrapping several libraries for online visualizations at the front-end and the organization of large biological data sets at the server-side allows for setting up a high-performance user-defined browser visualization for Hi-C data with just a few changes in the code. Availability and implementation: The source code, written in Python, of Bekvaem alongside its documentation and sample data is freely available on heiDATA . A demonstration server is available here - URL: http://pi306a.itp.uni-heidelberg.de/bekvaem (accessed: 20/09/2019).
Keywords: Hi-C, contact map, genomic data, visualization.
Хофманн А.*1, Мюггенбург Я. 2, Кремазы Ф. 3, Хеерманн Д.В. 4
1, 2, 4 Институт теоретической физики, Гейдельбергский университет, Гейдельберг, Германия
3 Национальный институт здравоохранения и медицинских исследований, Университет Версаль-Сен-Кантен-анИвелин, Монтиньи́-ле-Бретоннё, Франция
* Корреспондирующий автор (Andreas.Hofmann@thphys.uni-heidelberg.de)
Получена: 13.09.2019; Доработана: 22.09.2019; Опубликована: 27.09.2019
BEKVAEM: ИНТЕГРИРОВАННЫЙ ОБОЗРЕВАТЕЛЬ ДАННЫХ ДЛЯ HI-C DATA
Техническая спецификация
Аннотация
Актуальность: Визуализация контактных карт Hi-C на основе браузера наряду с дополнительными дорожками данных – это сложная вычислительная задача, требующая эффективного использования программного обеспечения для работы с небольшими клиентами. Для решения этой проблемы существует мало пакетов программного обеспечения, а их модификация – громоздка. Результаты: Мы создали «Bekvaem» для решения этих проблем с помощью высокоуровневых интерфейсов «Python». Объединение нескольких библиотек для онлайн-визуализаций во внешнем интерфейсе и организация больших наборов данных для хранения биологической информации со стороны сервера позволяет настроить высокопроизводительную пользовательскую визуализацию браузера для данных Hi-C с помощью всего лишь нескольких изменений в коде. Наличие и реализация: Исходный код Bekvaem, написанный на Python, наряду с документацией и примерами данных находится в свободном доступе на heiDATA . Демонстрационный сервер доступен по ссылке: http://pi306a.itp.uni-heidelberg.de/bekvaem (дата обращения: 20.09/2019).
Ключевые слова: Hi-C, контактная карта, геномные данные, визуализация.
1. Introduction
Genome-wide 3C-based experiments, such as Hi-C, enable insights into the 3D genome organization at an unprecedented resolution. The analysis of Hi-C contact information alongside with other genomic data, such as ChIP-seq or RNA-seq, allows for probing correlations between genomic information instead of analyzing each separately. With the help of such a combined analysis it has been suggested that proteins shape the hierarchical organization of eukaryotes and transcription that of prokaryotes [1]. Inversely, topological associated domains (TADs) that act as barriers to restrain enhancer-promoter contacts involved in transcription regulation [2] have been identified using Hi-C and other chromatin marks are just correlated to TADs. These findings illustrate the need of an integrated as well as interactive visualization of Hi-C contact maps alongside other genomic data. Several tools for the visualization of Hi-C and other genomic data were developed and released in the last years (see e.g. [3], [4], [5], [6] and the supplementary material). Focusing mainly on mammalian genomes, the tools often provide complete data processing libraries covering all the necessary steps from Hi-C sequencing data to the visualization of the processed data. A resulting disadvantage is that the import of files containing already generated Hi-C contact matrices is not supported and hence the flexible combination with other tools or rather existing data pipelines is not possible. The necessity of being able to program in low-level programming languages, such as C, as well as large and complex codebases are obstacles for customizing these tools. Our aim was twofold. First, we wanted to keep the Hi-C visualization pipeline Bekvaem generic and as easy to modify as possible. Second, its usability and performance should be on a par with existing tools.
2. Methods
Bekvaem aims to unify all steps involved in the creation of browser-based visualization of Hi-C contact maps in the highlevel language Python. By making use of Bokeh and HoloViews, graphs to the web interface are included using a syntax similar to that of 'offline' plotting libraries such as Matplotlib or ggplot. The workflow of introducing new types of data to the Hi-C analysis is brought down to writing a class with read-in, plotting and processing methods. The hierarchy of classes representing Hi-C data as well as other experimental data is designed around generic graph types, such as a heat map for the Hi-C contact map and a line graph for ChIP-seq data. These classes handle I/O, pre-processing and live aggregation of the data sources, if applicable. Offering a broad range of powerful libraries and interfaces to many programming languages (R, C), Python handles most existing data sources and processing routines. The bottleneck of displaying large data sets on a restricted screen resolution is addressed by just-in-time compiled regridding routines that allow live exploration of the data sets without fixed zoom levels. Individual plot elements are initialized in HoloViews, a down-stream library to Bokeh. By supplying data pipes and axes range streams to the plot containers, manipulation of the plot or elements of the user interface results in a call to the callback function of the container in which regridding and filtering operations can be placed. Dynamic loading of the requested data using cooler for the Hi-C contact maps and pyBigWig for continuous complementary tracks allows Bekvaem to visualize large genomes. Meta information that is integral to an understanding of certain data tracks is accessed via Bokeh's HoverTool, a dynamic HTML widget that pops up on hover actions. Revealing information only in the user-requested region increases the quantity of displayable data while maintaining the lucidity of the visualization. The synchronization of the server and client view is handled by the internal plotting server of Bokeh and no programming is required for its usage. Internally a document body of the browser visualization is built in Python with the Bokeh library and synchronized in a JavaScript Object Notation (JSON) format with the client side. Subsequently Bokeh's JavaScript library BokehJS renders the plots on the client side using the HTML5 Canvas element.
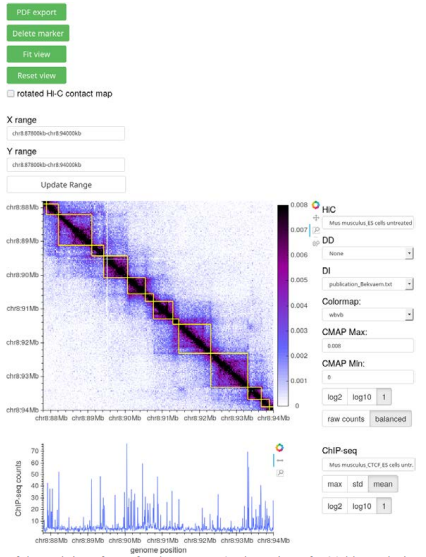
Figure 1 – Screenshot of the web interface of Bekvaem. A 6 Mb section of a 20 kb resolution Hi-C contact map of untreated M. musculus embryonic stem cells overlaid with a domain detection track is shown. CTCF counts of a complementary ChIP-seq experiment are displayed alongside the Hi-C contact map. Data from [7].
3. Application
Bekvaem is conceived to visualize Hi-C contact maps of any genome alongside complementary tracks. Besides Hi-C contact maps in square and triangular form, several additional data tracks of domain detection, protein binding, gene expression and gene databases were added to the pool of implemented plots. First macros that are helpful for the data exploration were exposed via the user interface (UI). Given a data track of RNAcounts, genes can be filtered on their expression rates. Besides, the UI contains HTML widgets to interchange the data sources and adjust the color scale of the color bar of the Hi-C contact map. The user has access to markers to record positions along the genome and a pdf-export routine was written to capture the current view. Figure 1 shows the output of Bekvaem using a Hi-C contact map of M. musculus. The layout of the visualization can be modified in a rich fashion by a plain-text configuration file. The visualization can be installed and used on a local host or exposed to the general web. For the latter a reverse-proxy such as NGINX can be used to embed the visualization in a larger web application.
4. Conclusion
We present a slim and interactive browser application capable of visualizing Hi-C contact maps alongside complementary data tracks. Besides Hi-C contact maps genome-wide data, such as ChIP-seq and RNA-seq, can be included in the layout. Bekvaem can be utilized for the visualization of any genomes including mammalian genomes.
Conflict of Interest
None declared.
Конфликт интересов
Не указан.
Funding
AH and DWH would like to acknowledge funding from a grant by the International Human Frontier Science Program Organization [RGP0014/2014].
Финансирование
Эта работа была поддержана исследовательским грантом: International Human Frontier Science Program Organization [RGP0014/2014].
Список литературы
Sexton T. The Role of Chromosome Domains in Shaping the Functional Genome / Sexton T. and others // Cell, – 2015. – 160(6). – P.1049–1059.
Franke M. Formation of new chromatin domains determines pathogenicity of genomic duplications / Franke M. and others // Nature, – 2016. – 538(7624). – P.265–269.
Kerpedjiev P. Higlass: Web-based visual exploration and analysis of genome interaction maps / Kerpedjiev P. and others // bioRxiv, – 2017
Robinson J.T. Juicebox.js Provides a Cloud-Based Visualization System for Hi-C Data / Robinson J.T. and others // Cell Syst., – 2018. – 6(2). – P.256–258.e1.
Serra F. Automatic analysis and 3D-modelling of Hi-C data using TADbit reveals structural features of the fly chromatin colors / Serra F. and others // PLOS Computational Biology, – 2017. – 13(7):e1005665.
Wang Y. The 3D Genome Browser: A web-based browser for visualizing 3D genome organization and long-range chromatin interactions / Wang Y. and others // Genome Biol., – 2018. – 19(1). – 151 p.
Nora E.P. Targeted degradation of ctcf decouples local insulation of chromosome domains from genomic compartmentalization / Nora E.P. and others // Cell, – 2017. – 169(5). – P.930–944.e22.