Вернуться к статье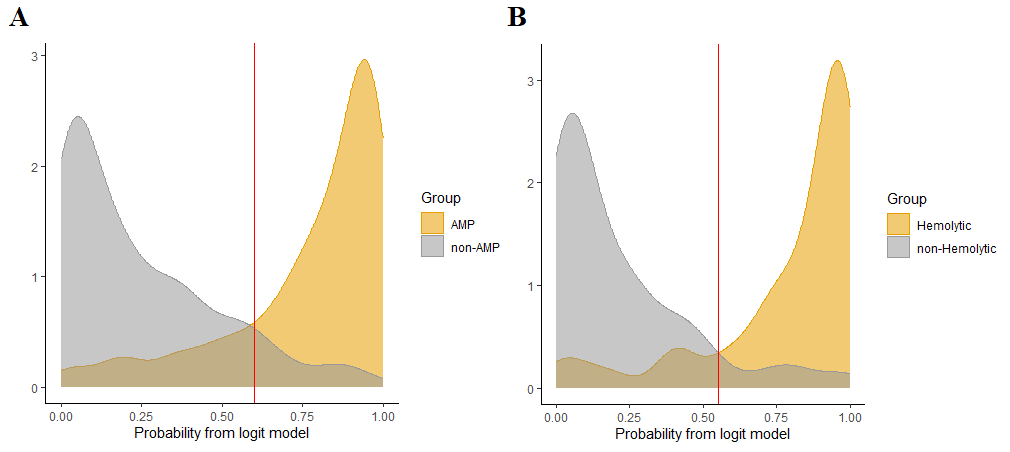
Машинное обучение с применением множественной логистической регрессии для предсказания антимикробных и гемолитических пептидов и их обнаружения в крупных белках
Results of antimicrobial and hemolytic activity prediction (validation on test sets):
A – Performance of the model for antimicrobial activity prediction; B – Performance of the model for hemolytic activity prediction
orange density plots correspond to positive groups and grey plots correspond to negative groups; red vertical lines represent optimal cut-offs for distinguishing between positive and negative groups (0.6 for the AMPs model and 0.55 for the HPs model)