
Интеграция генетических факторов риска и лекарственно-ассоциированных генов при терапии биполярного расстройства: биоинформатический и системно-фармакологический анализ сигнальных путей
Интеграция генетических факторов риска и лекарственно-ассоциированных генов при терапии биполярного расстройства: биоинформатический и системно-фармакологический анализ сигнальных путей

Аннотация
Биполярное расстройство (БАР) отличается высокой наследуемостью и клинической неоднородностью. Геномные исследования выявили множество локусов риска, но их связь с молекулярным действием применяемых препаратов изучена недостаточно.
Цель: оценить биологическую связь между генетической архитектурой риска БАР и генами, связанными с препаратами, применяемыми для его лечения.
Связи локусов БАР с генами классифицировали по доказательности, сформировав строгий, функционально расширенный и широкий локусный наборы. Связи препаратов с генами отбирали из архивированных записей DrugBank 6.0 и внешних источников. В первый уровень включали прямые взаимодействия с количественными значениями Ki, Kd, IC50 или EC50; механистические, фармакокинетические и фармакогеномные связи анализировали отдельно. Совпадения определяли по обозначениям HGNC, функциональное обогащение оценивали в g:Profiler. При наличии учитывали фармакологический контекст и взаимодействие с мишенью у человека.
Три набора БАР содержали 80, 307 и 331 обозначение гена; g:Profiler распознал соответственно 68, 249 и 273. Первый уровень включал 45 связей «препарат–ген» и 22 мишени. HTR6 был единственным точным совпадением со строгим набором. При использовании условного фонового набора белок-кодирующих генов оно не имело убедительной статистической значимости (63 и 22 гена; p = 0,0695). В строгом наборе значимых после коррекции категорий не выявлено. Активность высокопороговых потенциалзависимых кальциевых каналов была значима только в функционально расширенном наборе (CACNA1B, CACNA1C, CACNB2; p = 0,0486). Первый уровень был обогащён моноаминергическими путями и путями рецепторов, сопряжённых с G-белком. Обогащение кальциевого сигнального пути (p = 4,15 × 10⁻⁶) определялось восемью рецепторными генами, а не генами кальциевых каналов. Для третьего уровня преобладал метаболизм ксенобиотиков с участием цитохромов P450. Общего значимо обогащённого кальциевого пути для генов БАР и лекарственных мишеней не выявлено.
Совпадение приоритизированных генов БАР с лекарственными мишенями было ограниченным. HTR6 остаётся кандидатом для дальнейшей проверки; GSK3B заранее определён как связующее звено между AKAP11 и действием лития. Результаты указывают на тематическую связь биологии кальциевых каналов при БАР с рецепторно-опосредованной сигнализацией препаратов, но не подтверждают наличие биомаркеров ответа на лечение или общий механизм генетического риска и действия лекарств.
1. Introduction
Bipolar disorder (BD) is a severe and recurrent psychiatric disorder characterized by episodes of mania, hypomania, and depression. Its clinical presentation is heterogeneous, and early differentiation from major depressive disorder (MDD) remains a persistent diagnostic challenge. Accurate phenotyping is therefore essential for genomic and pharmacogenomic studies because diagnostic misclassification can dilute association signals and distort treatment-response interpretation. Recent work on electronic health records, natural language processing, and clinical decision support systems has emphasized the need for validated diagnostic labels when studying BD and its differentiation from MDD
.Genetic studies have consistently demonstrated that BD is highly heritable and polygenic. Early genome-wide association studies implicated loci such as ANK3, CACNA1C, and ODZ4/TENM4, supporting the involvement of neuronal excitability, calcium-channel biology, and neurodevelopmental mechanisms
, , . Subsequent large-scale analyses expanded the number of associated loci, with Stahl et al. identifying 30 loci and Mullins et al. reporting 64 loci in more than 40,000 BD cases , . More recent multi-ancestry work has substantially increased the resolution of BD genomics, identifying hundreds of genome-wide significant loci and prioritizing credible genes , .In parallel, rare-variant studies have added another layer of biological interpretation. Exome sequencing has identified AKAP11 as a risk gene shared between BD and schizophrenia, with functional relevance to GSK3B, a major signaling node implicated in lithium biology
, , . These findings suggest that common and rare variant architectures may converge on intracellular signaling systems relevant to mood regulation and treatment response.Despite this progress, the translation of genomic findings into psychopharmacological mechanisms remains limited. Current BD treatments include lithium, anticonvulsant mood stabilizers, atypical antipsychotics, and antidepressants in selected clinical contexts
, . These medications act through diverse receptors, transporters, enzymes, ion channels, and intracellular pathways, but the extent to which these pharmacological targets overlap with BD genetic risk genes is unclear.The aim was to compare evidence-stratified BD locus-to-gene mappings with drug-associated genes for medications used in BD. We evaluated exact gene-level overlaps, predefined mechanistic bridges, and pathway patterns while separating direct pharmacodynamic targets, pharmacokinetic genes, pharmacogenomic markers, and intracellular pathway nodes.
2. Research methods and principles
2.1. Study Design
This integrative study used genomic data and curated drug-associated evidence. Following methodological review, the primary workflow was redefined to separate heterogeneous locus-to-gene mappings and pharmacological evidence types. The initial workflow and the rationale for full reanalysis are described in Section 2.6.1. Primary analyses used the strict BD set and quantitative Tier 1 targets; broader mappings and other drug-gene relationships served as sensitivity layers.
2.2. Bipolar Disorder Gene Set Curation
BD-associated genes were curated from major GWAS, trans-ancestry GWAS, and exome sequencing studies. Principal GWAS sources were Stahl et al. (2019), Mullins et al. (2021), O'Connell et al. (2025), and Zhang et al. (2026)
, , , . Palmer et al. (2022) provided rare-variant exome evidence . Earlier loci provided historical context , , . Cross-disorder studies informed broader interpretation , , .Each source-level locus-to-gene record was assigned one or more explicit mapping methods: rare-variant exome evidence, a fine-mapped credible variant linked by VEP or ABC, formal TWAS/eQTL colocalization, significant TWAS, FOCUS transcriptome fine-mapping, isoTWAS, SMR with HEIDI support, MAGMA gene-based association, or proximity/manual locus assignment. All supporting methods were retained in an evidence matrix rather than reduced to the nearest gene alone. The complete mapping rules, evidence matrix, set membership, symbol-resolution checks, and overlap sensitivity results are provided in Supplementary Table S20.
Three nested BD gene sets were defined:
· strict mapping set: exome evidence, formal colocalization, or an O'Connell fine-mapped credible variant linked by VEP/ABC with at least three supporting evidence items (n = 80 symbols);
· functionally expanded set: the strict set plus significant TWAS, FOCUS posterior inclusion probability ≥ 0.8, isoTWAS, significant SMR with HEIDI support, MAGMA, VEP, or ABC evidence (n = 307);
· broad-locus set: the functionally expanded set plus proximity-to-credible-variant and manually retained historical or current locus assignments (n = 331).
Before method-specific mapping was introduced, BD genes were assigned to four interpretive categories: 39 core genes, 56 high-confidence functional genes, 3 extended historical genes, and one predefined bridge node. The 39 core and 56 high-confidence genes formed the 95-gene comparator; the three extended genes and GSK3B bridge were retained for interpretation rather than included in that set. Because this source-level classification combined different strengths and mechanisms of evidence without a uniform gene-level mapping rule, it was replaced for primary inference by the explicit method-specific sets defined above. The complete initial workflow and rationale for reanalysis are described in Section 2.6.1. Predefined pharmacological bridge nodes were not added to the revised BD sets. Official HGNC symbols were used where available; unmapped or retired transcript identifiers were retained in quality-control records but excluded from term-level interpretation when not recognized by g:Profiler.
2.3. Drug Selection
The primary drug list was based on medications used in BD treatment according to major clinical guidance
, . It included lithium carbonate, valproic acid, lamotrigine, carbamazepine, quetiapine, olanzapine, aripiprazole, risperidone, and lurasidone. An additional antidepressant block included sertraline, escitalopram, fluoxetine, venlafaxine, and bupropion because of their relevance to pharmacogenomics, monoamine transport, and mood-switch risk , , . Antidepressants were not interpreted as universal BD treatments.2.4. Drug-Associated Gene Data Extraction and Curation
Drug-associated information was initially extracted from DrugBank 6.0 / DrugBank Online records retrieved and archived locally by the authors on 10 June 2026
. DrugBank accession identifiers and the audit trail linking curated entries to the archived records are provided in Supplementary Table S15. Direct interactions were then checked against ChEMBL and other target databases; quantitative Ki, Kd, IC50, or EC50 values were recorded at the drug-gene level when available. Original DrugBank PDF records are not redistributed because of licensing restrictions, whereas reproducible derived tables are provided in Supplementary Tables S2, S3, S15, and S21.Database annotations were interpreted with reference to ChEMBL, DGIdb, the IUPHAR/BPS Guide to Pharmacology, and the Therapeutic Target Database
, , , . Regulatory and prescribing information was checked against DailyMed and Drugs@FDA , . Additional target-level verification used DGIdb, the Therapeutic Target Database, Open Targets, and PubChem , , , . Pharmacogenomic relationships were assessed using CPIC guidance and PharmGKB-related evidence where applicable , , .For each drug-gene relationship, the extracted fields included drug, HGNC symbol, interaction type and direction, evidence source, quantitative affinity or potency, assay context, CNS penetration, therapeutic exposure, and human target-engagement evidence when available. Tier 1 required a direct gene-resolved interaction with a quantitative Ki, Kd, IC50, or EC50 value. Tier 2 comprised experimentally supported mechanistic nodes without a qualifying quantitative direct-interaction record. Tier 3 comprised pharmacokinetic enzymes and transporters. PGx association markers were kept separate and were not treated as targets. Quantitative potency and CNS engagement were recorded as contextual evidence and did not by themselves determine tier membership. Contested, broad protein-group, or insufficiently gene-specific relationships were excluded from the primary target set. The complete adjudicated evidence tiers, quantitative Tier 1 records, secondary mechanistic records, pharmacokinetic genes, and target-engagement audit are provided in Supplementary Table S21.
2.5. Direct Gene-Level Overlap and Predefined Bridge Nodes
The primary direct-overlap analysis matched HGNC symbols between the strict BD mapping set and quantitative Tier 1 targets. A direct overlap was defined as an identical approved symbol in both sets. Overlap with the functionally expanded and broad-locus BD sets and with Tier 2, Tier 3, and PGx layers was evaluated secondarily.
Predefined bridge relations were analyzed separately from exact overlap. GSK3B met the quantitative Tier 1 rule through direct lithium inhibition, but it was not present in any BD mapping set and had been selected a priori because of the AKAP11-GSK3B-lithium hypothesis. It was therefore retained as a predefined bridge rather than counted as an independently discovered overlap.
An illustrative one-sided hypergeometric calculation contextualized exact overlap using the protein-coding subsets of the strict BD and Tier 1 lists and an HGNC protein-coding universe of 19,296 approved genes downloaded on 22 July 2026. This broad background was not matched for druggability or annotation density and was not treated as a definitive convergence test. Complete overlap calculations based on the method-specific BD sets and quantitative Tier 1 targets are provided in Supplementary Table S22.
2.6. Pathway Enrichment Analysis
2.6.1. Initial Analysis and Rationale for Reanalysis
The initially submitted workflow used the source-level BD classification described in Section 2.2. Exact overlap was evaluated between the 95-gene combination of 39 core and 56 high-confidence functional genes and 21 unique direct pharmacodynamic targets. Enrichr
, was queried with four sets: the 39 core genes, the 95-gene combination, 35 unique drug-associated genes, and their 129-gene union. Enrichment was assessed in GO Biological Process, GO Molecular Function, KEGG 2021 Human, and Reactome 2022 using each library's default background. Adjusted p-values were interpreted within each query and library; no global correction across analyses or formal semantic pruning of redundant GO terms was applied.A subsequent g:Profiler sensitivity stage tested direct pharmacodynamic targets (n = 21), PK/PGx genes (n = 6), mechanistic nodes (n = 9), drug-associated genes after excluding antidepressants (n = 29), the same set after additionally excluding CYP genes (n = 27), and two combined BD-drug sets (n = 115 and n = 121), using the annotated-domain background and g:SCS correction within each query. The methodological review identified two principal limitations: the 95-gene BD set did not record a uniform mapping rule for every gene, and the 35-gene drug set combined direct pharmacodynamic targets, mechanistic nodes, pharmacokinetic genes, and association markers. These features could affect gene attribution and make pathway signals dependent on heterogeneous annotation classes. Therefore, exact-overlap and enrichment analyses were fully recomputed using the strict, functionally expanded, and broad-locus BD sets and the quantitative drug-evidence tiers. Supplementary Table S12 and Tables S16–S19 preserve the initial sensitivity and enrichment outputs as an analytical record; they were not used for primary inference. Tables S20-S24 contain the method-specific mapping, evidence tiers, recomputed primary results, candidate assessment, and figure source data.
2.6.2. Revised Primary Enrichment Analysis
The revised BD queries were the strict mapping set (80 input symbols; 68 recognized), functionally expanded set (307; 249 recognized), and broad-locus set (331; 273 recognized). The primary drug query was Tier 1 (22 input and recognized genes); secondary queries were Tier 2 (n = 2), Tier 3 PK (n = 5), the separate PGx marker layer (n = 1), and Tier 1 plus Tier 2 (n = 24). Primary pathway enrichment was recomputed on 22 July 2026 using Gene Ontology, KEGG, and Reactome
, , through the g:Profiler /api/gost/profile/ endpoint . Parameters were hsapiens, unordered query, annotated-domain background, GO Biological Process, GO Molecular Function, KEGG, and Reactome sources, user threshold 0.05, g:SCS correction within each query, all results returned, underrepresentation disabled, and electronic GO annotations retained. The reported server version was e114_eg62_p19_27110d83. Full results are provided in Supplementary Table S22.Representative heatmap terms were selected to show the strongest nonredundant layer-specific signals and the calcium, monoaminergic, and xenobiotic themes defined for this analysis. Grey cells denote terms that did not meet g:SCS-adjusted p < 0.05, and white cells denote terms not returned for the corresponding query. No formal semantic pruning of redundant GO terms was performed. Enrichr adjusted p-values from the initial analysis and g:Profiler g:SCS-adjusted p-values from the revised analysis were not compared directly because the services use different correction procedures and gene-domain definitions.
2.7. Candidate Prioritization and Visualization
Candidates were ranked with a transparent rule-based 0-11 score comprising BD genetic evidence (0-3), drug evidence (0-3), cross-layer relation (0-4), and identified human CNS target engagement (0-1). Bands denoted exact overlap (A), a predefined bridge (B), or thematic/one-sided evidence (C). The score is not a probability, clinical score, or treatment-response biomarker. The Venn diagram used raw symbol counts and schematic circles; the heatmap displays layer-specific g:SCS-adjusted p-values. The scoring audit is in Supplementary Table S23, and figure source data are in S24
3. Main results
3.1. Overview of Genomic Evidence for Bipolar Disorder
The genomic literature reviewed for this study shows a clear expansion from early individual loci to large-scale multi-ancestry maps of BD risk architecture. Early GWAS implicated ANK3 and CACNA1C, followed by larger studies identifying additional loci such as ODZ4/TENM4, TRANK1, and NCAN. Stahl et al. (2019) identified 30 genome-wide significant loci, while Mullins et al. (2021) expanded this to 64 loci and reported enrichment in synaptic signaling pathways and drug target gene sets , . O'Connell et al. (2025) further expanded BD genomic discovery to 298 genome-wide significant loci and prioritized credible genes across ancestries . Palmer et al. (2022) identified AKAP11 as a rare-variant risk gene with relevance to GSK3B biology . Table 1 summarizes the principal genomic studies and their roles in gene prioritization.
Key genomic studies of bipolar disorder
earlier GWAS, cross-disorder, and transcriptomic sources are discussed in the text and listed in the References; the complete locus-to-gene evidence matrix and mapping quality-control records are provided in Supplementary Table S20
Source | Study type | Main contribution to this analysis |
Stahl et al., 2019 | GWAS | Established a larger common-variant BD locus map and reinforced ion-channel and synaptic biology. |
Mullins et al., 2021 | GWAS meta-analysis | Provided functional genomic evidence, including HTR6, and prior evidence for enrichment in drug target gene sets. |
Palmer et al., 2022 | Exome sequencing | Identified AKAP11 as a rare-variant risk gene and supported the predefined AKAP11-GSK3B-lithium bridge. |
O'Connell et al., 2025 | Multi-ancestry GWAS/fine-mapping | Provided the most current large-scale BD genomic source used for credible gene curation. |
Zhang et al., 2026 | Trans-ancestry GWAS | Added East Asian/European trans-ancestry context and pharmacologically tractable high-confidence genes. |
3.2. Curated Bipolar Disorder Gene Set
The method-specific locus-to-gene mapping produced 80 strict symbols, 307 functionally expanded symbols, and 331 broad-locus symbols. The sets were nested by construction. The strict set was restricted to exome evidence, formal colocalization, or multi-evidence fine-mapped variant-to-gene links; the functional and broad sets added progressively less restrictive mapping classes. Of the strict symbols, 63 were approved protein-coding genes for the illustrative overlap calculation and 68 were recognized by g:Profiler. GSK3B was not added to any BD mapping set. Gene-level evidence assignments and membership of all three mapping sets are reported in Supplementary Table S20.
3.3. Curated Drug-Associated Gene Dataset
The curated drug-associated dataset contained 76 rows across 14 medications. After evidence adjudication, Tier 1 comprised 45 quantitative direct-interaction rows and 22 unique genes. Tier 2 contained two genes (CACNA1E and CHRNA4), Tier 3 contained 19 PK rows and five unique genes (ABCB1, CYP2B6, CYP2C19, CYP2D6, and CYP3A4), and three PGx rows mapped to one unique marker gene (HTR2A). Four contested mechanistic rows, two insufficiently gene-specific rows, and one PK regulatory node outside the Tier 3 core were not included in the primary target analysis. The main drug classes are summarized in Table 2; the 76-row curated matrix and source-validation records are provided in Supplementary Tables S2 and S3. Complete evidence-tier assignments and quantitative pharmacology details are provided in Supplementary Table S21.
Drug classes and representative molecular target categories included in the analysis
the full 76-row curated drug-associated matrix is provided as Supplementary Table S2; representative genes in Table 2 span direct pharmacodynamic, mechanistic, pharmacokinetic, and pharmacogenomic layers and are not all Tier 1 targets; complete tier assignments are provided in Supplementary Table S21
Drug group | Medications included | Representative molecular targets | Main target categories | Role in this study |
Lithium | Lithium carbonate | GSK3B, GSK3A, IMPA1, IMPA2 | Intracellular pathway nodes and enzymes | Mood stabilizer block and lithium-relevant bridge to the AKAP11-GSK3B axis. |
Anticonvulsant mood stabilizers | Valproic acid, lamotrigine, carbamazepine | ABAT, ALDH5A1, HDAC2, HDAC9, SCN1A, CACNA1E, CHRNA4, ABCB1, CYP3A4 | Enzymes, ion channels, epigenetic enzymes, transporters, metabolic genes | Captures anticonvulsant and mood-stabilizing mechanisms relevant to ion-channel, GABAergic, epigenetic, and pharmacokinetic biology. |
Atypical antipsychotics | Quetiapine, olanzapine, aripiprazole, risperidone, lurasidone | DRD2, DRD3, HTR2A, HTR1A, HTR2C, HTR6, HTR7, HRH1, CHRM1, ADRA1A, ADRA1B | Dopaminergic, serotonergic, adrenergic, histaminergic, and muscarinic receptors | Provides the main receptor-level pharmacodynamic set for pathway-relatedness analysis. |
Antidepressant pharmacogenomic block | Sertraline, escitalopram, fluoxetine, venlafaxine, bupropion | SLC6A4, SLC6A2, SLC6A3, HTR2A, CYP2D6, CYP2C19, CYP2B6 | Monoamine transporters, receptors, and pharmacogenomic enzymes | Included for pharmacogenomic and monoamine-transporter interpretation, not as universal bipolar disorder therapy. |
3.4. Direct Gene-Level Overlap and Mechanistic Bridge Analysis
Only one exact overlap was observed between the strict BD set and the 22 quantitative Tier 1 targets: HTR6, supported on the BD side by functional mapping evidence and on the drug side by an olanzapine interaction with a representative Ki of 7.943 nM. GSK3B was a quantitative Tier 1 lithium interaction (Ki = 2 mM) but was not a BD-mapped gene and remained an a priori bridge. Table 3 ranks these and other candidates using the rule-based evidence rubric. The complete ranked candidate table and scoring rubric are provided in Supplementary Table S23.
Ranked candidate evidence assessment
the total score ranges from 0 to 11. Bands reflect relation type (A, exact overlap; B, predefined bridge; C, thematic or one-sided evidence); tied scores share the same rank using competition ranking; the score is intended for hypothesis prioritization and is not a validated probability, clinical score, or treatment-response biomarker
No. | Gene | Band / score | Candidate role | Evidence summary | Principal limitation |
1 | HTR6 | A / 10 | Exact gene overlap | BD: strict; drug: Olanzapine (Tier 1; Ki = 7.943 nM). | Only direct overlap; overlap enrichment is not significant and target-specific human CNS engagement was not identified. |
2 | GSK3B | B / 6 | Predefined AKAP11-lithium mechanistic bridge | BD: none; drug: Lithium carbonate (Tier 1; Ki = 2.0 × 10⁶ nM). | Not a BD-prioritized gene in the mapping sets; predefined bridge; lithium Ki exceeds usual serum exposure. |
3 | HRH1 | C / 5 | Tier 1 receptor-mediated calcium pathway contributor | BD: none; drug: Olanzapine (Tier 1; Ki = 3.5 nM); Quetiapine (Tier 1; Ki = 11.0 nM). | Human H1 occupancy exists, but there is no BD genetic prioritization; pathway relation is receptor-mediated and thematic. |
4 | CACNA1B | C / 4 | BD-side voltage-gated calcium signal | BD: strict; drug: none. | Strong disease-side evidence but no qualifying Tier 1 drug interaction in the curated set. |
4 | ADRA1A | C / 4 | Tier 1 receptor-mediated calcium pathway contributor | BD: none; drug: Quetiapine (Tier 1; Ki = 100.0 nM). | No BD genetic prioritization; calcium relation is based on a broad receptor-mediated pathway annotation. |
4 | ADRA1B | C / 4 | Tier 1 receptor-mediated calcium pathway contributor | BD: none; drug: Risperidone (Tier 1; Ki = 10.0 nM). | No BD genetic prioritization; calcium relation is based on a broad receptor-mediated pathway annotation. |
4 | CHRM1 | C / 4 | Tier 1 receptor-mediated calcium pathway contributor | BD: none; drug: Olanzapine (Tier 1; Ki = 10.0 nM). | No BD genetic prioritization; calcium relation is based on a broad receptor-mediated pathway annotation. |
4 | HTR2A | C / 4 | Tier 1 receptor-mediated calcium pathway contributor | BD: none; drug: Aripiprazole (Tier 1; Ki = 12.1 nM); Lurasidone (Tier 1; Ki = 2.0 nM); Olanzapine (Tier 1; Ki = 2.5 nM); Quetiapine (Tier 1; Ki = 120.0 nM); Risperidone (Tier 1; Ki = 0.29 nM). | Tier 1 and PGx annotations are present, but no BD genetic prioritization or target-specific CNS engagement was identified. |
4 | HTR2C | C / 4 | Tier 1 receptor-mediated calcium pathway contributor | BD: none; drug: Fluoxetine (Tier 1; Ki = 72.0 nM); Olanzapine (Tier 1; Ki = 10.0 nM). | No BD genetic prioritization; calcium relation is based on a broad receptor-mediated pathway annotation. |
4 | HTR7 | C / 4 | Tier 1 receptor-mediated calcium pathway contributor | BD: none; drug: Aripiprazole (Tier 1; Ki = 44.0 nM); Lurasidone (Tier 1; Ki = 0.5 nM); Risperidone (Tier 1; Ki = 4.3 nM). | No BD genetic prioritization; calcium relation is based on a broad receptor-mediated pathway annotation. |
11 | CACNA1C | C / 3 | BD-side voltage-gated calcium signal | BD: functionally expanded; drug: none. | Functionally expanded MAGMA evidence only; no qualifying Tier 1 drug interaction. |
11 | CACNB2 | C / 3 | BD-side voltage-gated calcium signal | BD: functionally expanded; drug: none. | Functionally expanded MAGMA evidence only; no qualifying Tier 1 drug interaction. |
11 | CACNA1E | C / 3 | Tier 2 calcium-channel mechanism | BD: none; drug: Lamotrigine (Tier 2; inhibitor). | Tier 2 mechanism without qualifying quantitative gene-level affinity; no strict BD mapping evidence. |
The Venn analysis used 80 curated strict BD symbols and 22 Tier 1 targets and identified HTR6 as the only shared symbol (Figure 1). For the illustrative protein-coding calculation, 63 strict BD genes and all 22 Tier 1 genes were compared against 19,296 HGNC protein-coding genes; the probability of at least one overlap was p = 0.0695. The result is therefore not statistically compelling and should be interpreted as candidate prioritization rather than target-level convergence. Complete overlap calculations are reported in Supplementary Table S22, and the Venn source counts are reported in Supplementary Table S24.
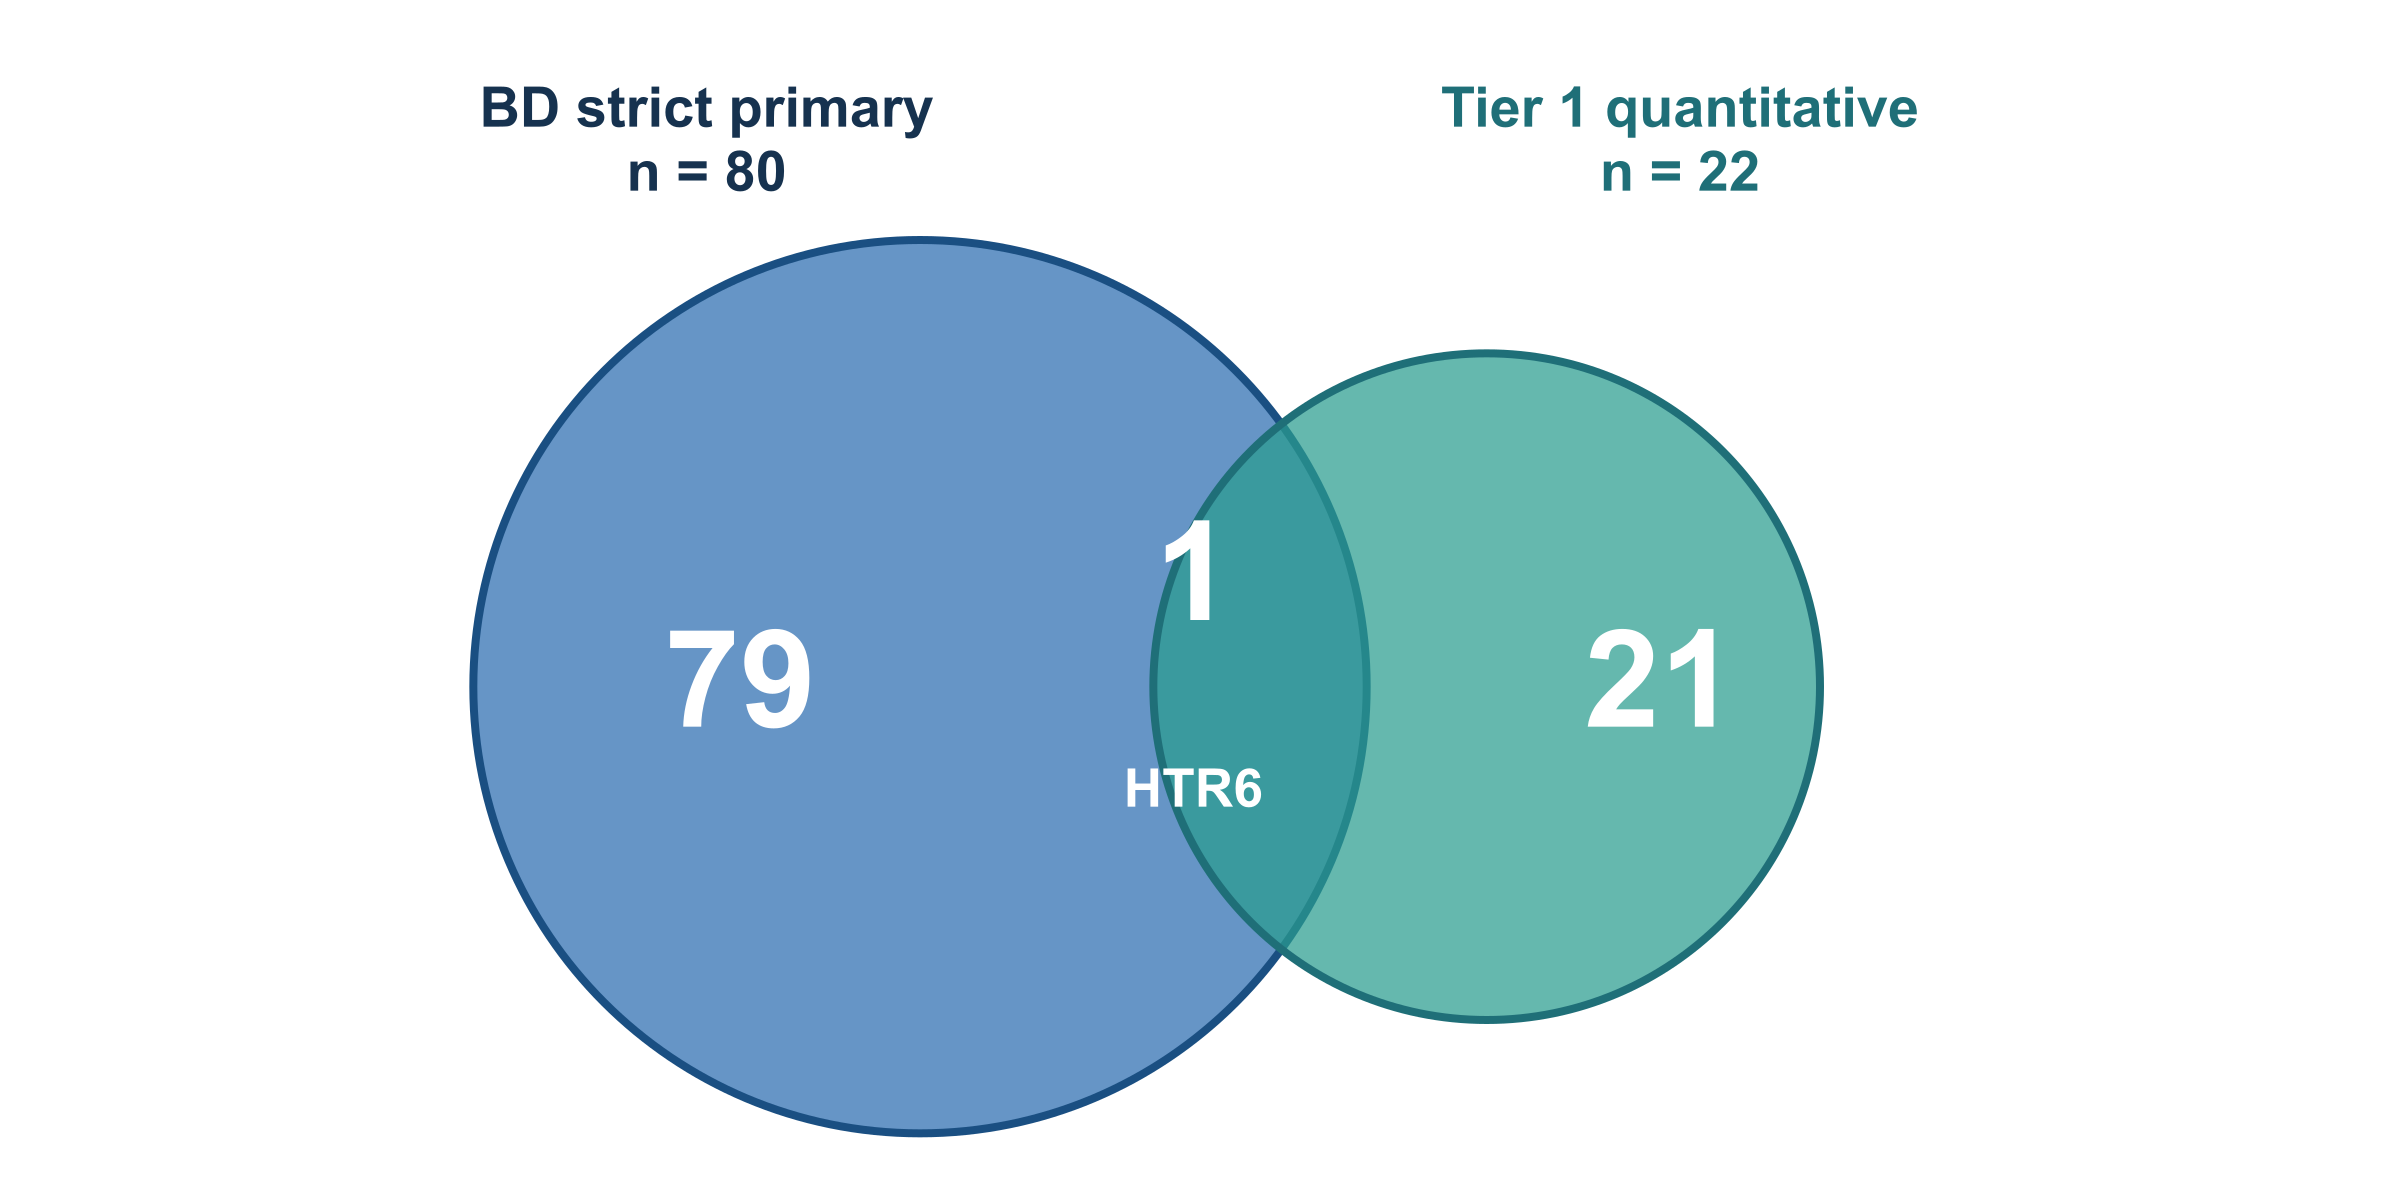
Exact gene overlap between the strict BD mapping set and quantitative Tier 1 targets
the raw curated sets contained 80 and 22 symbols, respectively, with HTR6 as the only shared gene; the illustrative protein-coding analysis used 63 and 22 genes and an HGNC universe of 19,296 genes (p = 0.0695); circle areas are schematic; the diagram does not establish a therapeutic mechanism or treatment-response biomarker; source data are provided in Supplementary Table S24
3.5. Pathway-Level Enrichment and Descriptive Relatedness
Primary g:Profiler enrichment compared the separated BD mapping and drug-evidence layers (Figure 2 and Table 4). The strict BD query had no g:SCS-significant term across GO:BP, GO:MF, KEGG, or Reactome. The functionally expanded BD set produced two significant GO:MF terms and two Reactome terms; the calcium-related result emphasized in the primary analysis was high voltage-gated calcium channel activity (GO:0008331; p = 0.0486), driven by CACNA1B, CACNA1C, and CACNB2. Full corrected enrichment outputs are provided in Supplementary Table S22.
The strict-set null result and the sensitivity-only calcium term show that disease-side enrichment depended on locus-to-gene mapping breadth. CACNA1B was present in the strict set, whereas CACNA1C and CACNB2 entered through the functionally expanded mapping. The calcium-channel finding is therefore biologically relevant but not robust to the strictest mapping definition. In the broad-locus set, the high voltage-gated calcium channel activity term showed the same direction but did not remain significant after correction (GO:0008331; g:SCS-adjusted p = 0.0650).
Tier 1 showed strong expected enrichment for monoaminergic receptors, transporters, GPCR signaling, and synaptic processes. Representative terms included Neuroactive ligand signaling (KEGG:04082; p = 3.65 × 10⁻²¹), Neuroactive ligand-receptor interaction (KEGG:04080; p = 1.06 × 10⁻¹¹), and Calcium signaling pathway (KEGG:04020; p = 4.15 × 10⁻⁶). The calcium term was contributed by ADRA1A, ADRA1B, CHRM1, HRH1, HTR2A, HTR2C, HTR6, and HTR7, all receptor genes rather than voltage-gated calcium-channel targets.
Tier 2 contained only CACNA1E and CHRNA4 and produced no corrected significant term. Tier 3 yielded expected xenobiotic and cytochrome P450 enrichment, including xenobiotic metabolic process (GO:0006805; p = 6.77 × 10⁻⁹). The separate PGx layer contained only HTR2A and produced one marginal GO:MF annotation (p = 0.04999); this one-gene result was not interpreted as pathway convergence.
When Tier 1 and Tier 2 were combined, calcium signaling remained significant (KEGG:04020; p = 4.52 × 10⁻⁷) and added CACNA1E to the eight Tier 1 receptor genes. However, the significant disease-side term was a GO molecular-function annotation for voltage-gated calcium-channel activity, whereas the drug-side term was a broad KEGG signaling pathway. No identical significant calcium annotation was shared across the BD and drug layers (Table 5).
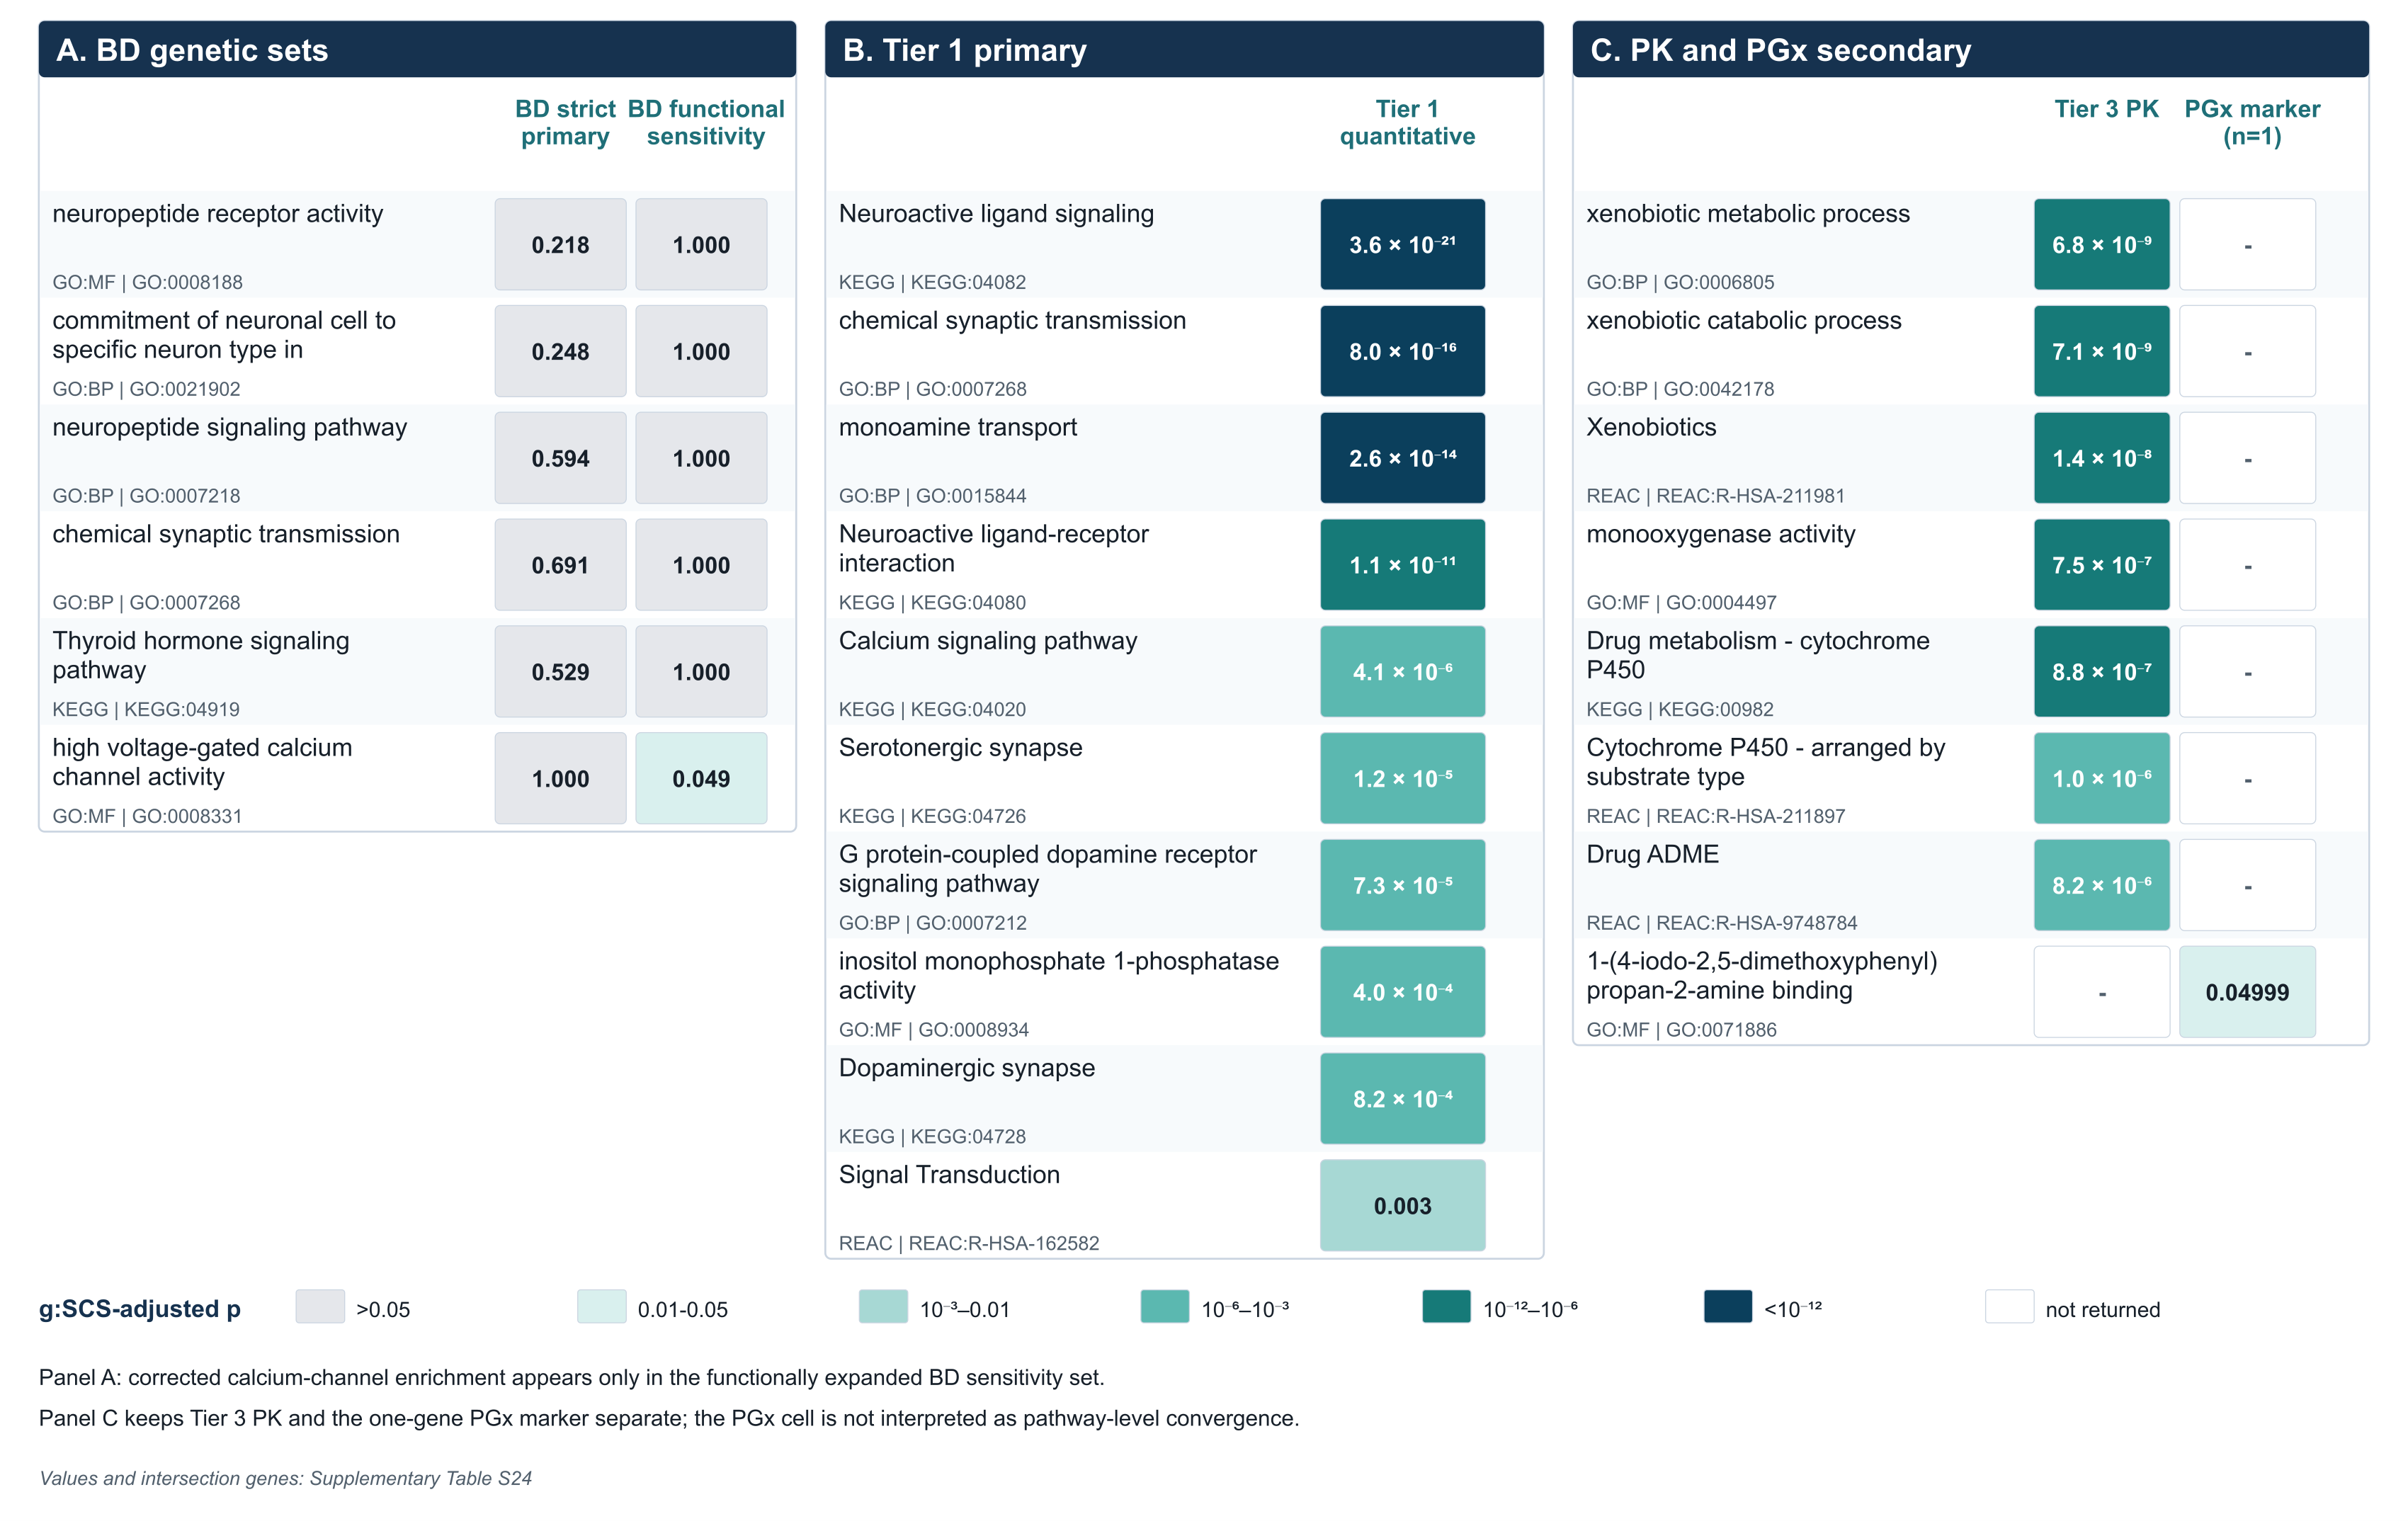
Pathway enrichment across BD mapping and drug-evidence layers
cell values are g:SCS-adjusted p-values; grey cells did not meet p < 0.05, and white cells indicate that the term was not returned; the strict BD set had no significant corrected term; high voltage-gated calcium channel activity was significant only in the functionally expanded BD set; tier 1 calcium signaling was driven by receptor genes; tier 3 PK and the one-gene PGx layer are shown separately; source values and term-level intersections are provided in Supplementary Table S24
Primary g:Profiler enrichment by evidence layer
correction was applied separately within each g:Profiler query; dash indicates no corrected significant term or no applicable intersection; full query results are provided in Supplementary Table S22
Evidence layer | Input / recognized | Database and term | g:SCS-adjusted p | Intersection genes | Interpretation |
Strict BD mapping | 80 / 68 | All four sources: no corrected term | — | — | Primary disease set; no significant enrichment. |
Functionally expanded BD | 307 / 249 | GO:MF GO:0008331; high voltage-gated calcium channel activity | 0.0486 | CACNA1B; CACNA1C; CACNB2 | Sensitivity-only disease-side calcium-channel signal. |
Tier 1 quantitative targets | 22 / 22 | KEGG:04082; Neuroactive ligand signaling | 3.65 × 10⁻²¹ | 16 receptor/transporter genes | Expected pharmacodynamic composition signal. |
Tier 1 quantitative targets | 22 / 22 | KEGG:04020; Calcium signaling pathway | 4.15 × 10⁻⁶ | ADRA1A; ADRA1B; CHRM1; HRH1; HTR2A; HTR2C; HTR6; HTR7 | Receptor-mediated drug-side calcium signal; no voltage-gated channel target. |
Tier 2 mechanistic | 2 / 2 | All four sources: no corrected term | — | — | No significant enrichment at this set size. |
Tier 3 PK | 5 / 5 | GO:BP GO:0006805; xenobiotic metabolic process | 6.77 × 10⁻⁹ | ABCB1; CYP2B6; CYP2C19; CYP2D6; CYP3A4 | Expected exposure and metabolism signal, not BD pathogenesis. |
PGx marker layer | 1 / 1 | GO:MF GO:0071886; ligand-binding annotation | 0.04999 | HTR2A | Single-gene annotation; not a pathway-level result. |
The layer-separated results distinguish three findings: no corrected pathway signal in the strict BD set; a calcium-channel term that appears only after functional expansion of BD mapping; and strong Tier 1 receptor/synaptic enrichment reflecting the pharmacology of the selected drugs. Calcium is the clearest cross-layer theme, but the disease and drug layers do not contribute to the same significant annotation.
Adding Tier 2 to Tier 1 retained the broad KEGG calcium pathway and introduced CACNA1E, whereas Tier 2 alone was not significant. Separating Tier 3 removed CYP/xenobiotic terms from the pharmacodynamic interpretation. These checks support the receptor and metabolism assignments within their own evidence layers, but they do not demonstrate formal disease-drug convergence.
Cross-layer evidence and calcium sensitivity analysis
illustrative hypergeometric p-value based on 63 strict BD protein-coding genes, 22 Tier 1 genes, and an HGNC universe of 19,296 genes; this is not a matched druggable-gene background
Comparison | Set size | Result | p-value / g:SCS-adjusted p | Contributing genes | Interpretation |
Exact strict BD-Tier 1 overlap | 80 raw / 22 | One shared symbol | 0.0695* | HTR6 | Not statistically compelling under the broad HGNC protein-coding background. |
Strict BD calcium result | 80 / 68 | No corrected calcium term | — | CACNA1B only in GO:0008331 | No robust disease-side enrichment under the strictest mapping. |
Functionally expanded BD calcium | 307 / 249 | GO:0008331 high voltage-gated calcium channel activity | 0.0486 | CACNA1B; CACNA1C; CACNB2 | Disease-side sensitivity signal. |
Tier 1 calcium | 22 / 22 | KEGG:04020 Calcium signaling pathway | 4.15 × 10⁻⁶ | ADRA1A; ADRA1B; CHRM1; HRH1; HTR2A; HTR2C; HTR6; HTR7 | Broad receptor-mediated drug-side signal. |
Tier 1 + Tier 2 calcium | 24 / 24 | KEGG:04020 Calcium signaling pathway | 4.52 × 10⁻⁷ | Tier 1 genes plus CACNA1E | Signal retained when the Tier 2 calcium-channel mechanism was added. |
Exact shared significant calcium annotation | BD vs drug layers | None | — | — | Supports thematic relatedness, not formal pathway convergence. |
4. Discussion
This integrative bioinformatics analysis examined whether evidence-restricted BD locus-to-gene mappings show biologically interpretable relatedness to quantitatively supported targets of medications used in BD. The primary comparison between the strict BD set and Tier 1 identified only HTR6, and the illustrative overlap test was not significant. Separating mapping methods and drug-evidence tiers also showed that pathway conclusions depend strongly on which layer is analyzed: the strict BD set had no corrected enrichment, the functionally expanded set yielded a calcium-channel term, Tier 1 was dominated by expected receptor and synaptic pharmacology, and Tier 3 isolated the CYP/xenobiotic component.
HTR6 was the only exact strict BD-Tier 1 overlap. BD evidence included formal eQTL colocalization and supporting functional mapping in Mullins et al. (2021); the representative olanzapine interaction had a Ki of 7.943 nM
, . This quantitative record supports Tier 1 membership but does not establish that HTR6 is a primary clinical mechanism of olanzapine in BD. Target-specific human CNS engagement was not identified, and the analysis did not test whether therapeutic exposure produces relevant HTR6 occupancy or whether the direction of the genetic effect is opposed by antagonism. Together with the non-significant overlap test, these limitations support treating HTR6 as a hypothesis-generating candidate rather than a treatment mechanism or response biomarker.GSK3B met the quantitative Tier 1 definition through direct lithium inhibition, with a representative Ki of 2 mM
, but it was not prioritized in any of the three method-specific BD mapping sets. Its inclusion in the AKAP11-GSK3B-lithium axis remained explicitly a priori , , . Moreover, the reported Ki is above usual therapeutic serum lithium concentrations, and no target-specific human CNS engagement measure was identified , . The axis is therefore biologically coherent as a predefined mechanistic bridge, but it is neither an independently discovered overlap nor proof of clinically relevant GSK3B target engagement.The Tier 1 enrichment profile was dominated by monoaminergic receptors, transporters, GPCR signaling, and synaptic terms. This is expected from the pharmacological composition of antipsychotic and antidepressant targets and is not independent evidence of BD pathogenesis. The ranked candidate table consequently gives the highest relational priority to the exact overlap HTR6 and the predefined GSK3B bridge, while receptor-only or disease-only calcium contributors remain in thematic band C. The ranking makes the evidence structure explicit but does not convert annotation enrichment into a clinical probability.
Calcium-related biology remained the most informative cross-layer theme, but the layer-separated analysis narrows its interpretation. The strict BD set did not show corrected calcium enrichment; high voltage-gated calcium channel activity reached significance only in the functionally expanded set and was driven by CACNA1B, CACNA1C, and CACNB2. In contrast, the Tier 1 KEGG calcium pathway was driven by adrenergic, muscarinic, histamine, and serotonin receptor genes rather than voltage-gated calcium-channel targets. Adding Tier 2 introduced CACNA1E and retained the broad KEGG signal, but Tier 2 alone was not enriched. Thus, the disease and drug layers implicate different components of calcium-dependent neurobiology and do not share an identical significant calcium annotation.
Tier 3 PK enrichment highlights a clinically relevant but conceptually separate layer. ABCB1, CYP2B6, CYP2C19, CYP2D6, and CYP3A4 produced expected xenobiotic and cytochrome P450 terms. These findings concern exposure, interactions, tolerability, and pharmacogenomic variability rather than BD genetic architecture. Their separation from Tier 1 prevents metabolism annotations from being presented as evidence of therapeutic target convergence.
The evidence ranking is intended to guide experimental prioritization. HTR6 could be tested through genotype- or expression-stratified pharmacology and target-engagement studies, whereas the AKAP11-GSK3B-lithium axis requires exposure-aware functional validation. Calcium candidates require experiments that distinguish voltage-gated channel mechanisms from receptor-mediated intracellular calcium signaling. None of the present scores or enrichment terms predicts individual treatment response.
Phenotype quality also remains important because BD-MDD misclassification can affect genomic discovery and treatment-response studies
. Future pharmacogenomic studies should use validated longitudinal phenotypes, including polarity, psychosis, age at onset, treatment exposure, and mood-switch history.5. Limitations
Several limitations should be considered. First, the strict, functionally expanded, and broad-locus sets reduce but do not eliminate uncertainty in GWAS locus-to-gene assignment. Fine-mapping, colocalization, TWAS, MAGMA, and proximity methods answer different questions and may prioritize different genes. The absence of corrected enrichment in the strict set and the appearance of the calcium-channel term only after functional expansion demonstrate this mapping sensitivity directly.
Second, quantitative Tier 1 curation improves pharmacological specificity but does not standardize assay species, tissue, construct, endpoint, or experimental conditions. A Ki or IC50 value does not by itself establish CNS penetration, therapeutic free concentration, receptor occupancy, or causal relevance to mood stabilization. Human target-engagement evidence was sparse, and broad or contested protein-group mappings had to be excluded.
Third, exact symbol overlap can underestimate network- or pathway-level relatedness, whereas pathway enrichment can overrepresent highly annotated receptor and CYP families. The layer-separated design reduces the latter problem but does not provide a matched null model for annotation density, druggability, or network degree.
Fourth, g:Profiler used an annotated-domain background and g:SCS correction separately within each query. The analysis did not implement a matched druggable-genome background, permutation testing, degree-matched network proximity, formal pathway-overlap testing, or leave-one-drug-class-out resampling. Enrichr and exclusion-based runs performed before the application of method-specific BD locus-to-gene mapping and quantitative drug-evidence tiering remain secondary because their correction procedures and gene-set definitions differ from the primary g:Profiler workflow. Future work should test alternative mapping thresholds, remove drug classes in turn, and evaluate whether the observed themes exceed matched null expectations.
Fifth, the analysis did not include patient-level treatment response, pharmacokinetic measurements, longitudinal exposure, or ancestry-specific pharmacogenomic stratification. Future studies should integrate these data with transcriptomics, proteomics, fine-mapped regulatory effects, therapeutic exposure, and direct target-engagement measures before evaluating clinical prediction.
Finally, antidepressants were included as a pharmacogenomic and monoamine-transporter block, not as universal BD treatments
, . Their interpretation should remain clinically cautious because antidepressant use in BD depends on polarity, mood stabilizer co-treatment, switch risk, and guideline context.Safety and pharmacokinetic genes were excluded from the main overlap analysis because they were not direct therapeutic targets or BD risk genes. Examples include HLA-B*15:02 and HLA-A*31:01 for carbamazepine hypersensitivity
, and UGT1A4, UGT2B7, CYP2C9, UGT1A6, and CYP1A2 for metabolism and exposure , . The complete audit is provided in Supplementary Table S11.6. Data and code availability. Supplementary materials
The supplementary files distinguish foundational curation materials from analyses performed at two stages. Tables S2, S3, S11, and S15 contain, respectively, the curated drug-gene matrix, source-validation records, the PGx and drug-safety gene list, and the DrugBank record audit; these materials support both analytical stages. Table S12 contains the initial local sensitivity analysis. Tables S16-S19 report enrichment analyses performed before the application of method-specific BD locus-to-gene mapping and quantitative drug-evidence tiering; they are provided only to document the analytical history and were not used for primary inference. Tables S20-S24 contain the analyses reported as primary results in this article: S20, evidence-stratified BD locus-to-gene mapping; S21, quantitative and secondary drug-evidence tiers; S22, primary g:Profiler enrichment and overlap results, which replace S16-S19 for primary interpretation; S23, ranked candidate evidence assessment; and S24, source data for Figures 1-2. DrugBank source PDFs are not redistributed because of licensing restrictions. Analysis scripts and machine-readable metadata are available from the corresponding author upon reasonable request.
7. Conclusion
This study integrated evidence-stratified BD locus-to-gene mappings with quantitatively supported and secondary drug-associated gene layers. Exact overlap between the strict BD set and Tier 1 was limited to HTR6 and was not statistically compelling. GSK3B remained a predefined AKAP11-lithium bridge rather than an independently discovered disease-drug overlap.
Tier 1 showed expected monoaminergic, GPCR, and synaptic enrichment, while Tier 3 isolated the xenobiotic-metabolism component. Calcium-related biology was the clearest cross-layer theme, but it arose from voltage-gated calcium-channel activity in the functionally expanded BD set and receptor-mediated KEGG calcium signaling in Tier 1. The layers did not share an identical significant calcium annotation.
The results provide a transparent hypothesis-generating framework, not validated treatment-response biomarkers or formal proof of mechanistic convergence. Future work should combine matched null models, network proximity, exposure and target-engagement data, functional experiments, and patient-level treatment outcomes.