Возраст-ассоциированные изменения характеристик свободно циркулирующей ДНК: полногеномный анализ
Возраст-ассоциированные изменения характеристик свободно циркулирующей ДНК: полногеномный анализ

Аннотация
Фрагменты свободно циркулирующей ДНК (сцДНК), обнаруживаемые в плазме крови, образуются в результате деградации геномной ДНК в ходе клеточной гибели. Настоящая работа является первым исследованием возраст-ассоциированной изменчивости характеристик сцДНК в образцах условно-здоровых людей из российской популяции. Проведенный анализ демонстрирует, что по мере старения организма происходят изменения характеристик сцДНК, которые наблюдаются по всему геному. На многих геномных интервалах обнаружены возраст-ассоциированные изменения количества и распределения длин образующихся фрагментов сцДНК. В настоящей работе мы идентифицировали геномные интервалы, в пределах которых заметны наиболее выраженные возраст-ассоциированные изменения количества фрагментов сцДНК. С использованием биоинформатических инструментов на этих интервалах выявлены белок-кодирующие гены. С помощью портала DISEASES и веб-инструмента voyAGEr для каждого гена получены сведения относительно его тканеспецифической возраст-ассоциированной экспрессии, связанной также с определенными состояниями и патологиями. Выявлены несколько закономерностей, указывающих на возможные взаимосвязи фрагментации ДНК и изменений уровня экспрессии генов.
1. Introduction
Human blood plasma contains DNA fragments originated through cellular death due to both programmed intracellular processes and pathological state. During the last decade, circulating free DNA (cfDNA) is a subject of detailed research as its fragments might be a source of valuable information concerning the patient’s condition. For example, cfDNA can be used as analyte to elicit the diagnostic biomarkers in cancer . The data obtained by cfDNA sequencing can be used to follow the cardiovascular patients’ condition .
The term “fragmentome” has been introduced to define a entire set of cfDNA molecules presented in plasma. Studying the ageing-related changes in fragmentome characteristics is a novel line of cell-free DNA research. Up to date there are no articles concerning age-associated variability of cfDNA characteristics that cover apparently healthy representatives of Russian population.
The purpose of current research is studying the fragmentome data obtained by plasma cfDNA sequencing for the cohort of apparently healthy subjects from Russian population. Within the research framework we studied age-associated variability of cfDNA characteristics, searched genomic intervals characterized by the most apparent age-associated changes in DNA fragmentation and located the genes lying on these intervals.
2. Materials and Methods
The study included 346 apparently healthy subjects aged from 20 to 78 years. Obtaining the biospecimens and clinical data from the participants was approved by the local ethics committee at Arte Med Assistance LLC (Saint Petersburg, extracts from a protocol of meeting No. 253 of May 26, 2021 and No. 276 of May 11, 2022) and at Federal State Budgetary Scientific Institution Izmerov Research Institute of Occupational Health (extract from a protocol of meeting No. 6 of September 27, 2023) and performed in accordance with the Helsinki 171 Declaration (Protocol No. 05112019 of 11.11.2019). All subjects gave written informed consent to participate in the study.
The study inclusion criteria were: absence of autoimmune, hematological, oncological, neurodegenerative and severe cardiovascular diseases in anamnesis, absence of acute and chronic respiratory disease, absence of active lung tuberculosis, absence of hepatitis B, C, HIV or syphilis.
The study exclusion criteria were:
1) ischemic heart disease for subjects aged less than 51 year;
2) morbid obesity or endocrine disease for subjects aged less than 40 years, body mass index (BMI) ≥40 kg/m2 or BMI ≥35 kg/m2 with severe complications associated with obesity for subjects aged less than 40 years;
3) previously diagnosed chronic inflammatory diseases and/or high-sensitive C-reactive protein (hs‐CRP) level > 5,0 mg/l for subjects aged less than 45 years;
4) hs‐CRP level > 5,0 mg/l l for subjects aged more than 45 years; inflammatory intestine diseases;
5) chronic bile ducts diseases, chronic liver diseases or cholestatic syndrome for subjects aged less than 40 years; renal failure, acute glomerulonephritis or acute kidney stone disease, chronic hepatic failure; we accepted the inclusion of subjects aged ≥ 60 years with compensated kidney and/or hepatic failure;
6) the other study exclusion criteria with no regards to the age of participants were:
a) benign neoplasms including ones registered in the anamnesis that are prone to malignization and/or decreases the participant quality of life;
b) severe congenital or inherited pathologies; severe inherited monogenic diseases in the anamnesis;
c) pregnancy or breast feeding in the case of female subject;
d) alcohol or drug addiction reported by the subject;
e) behavioral disorders and mental diseases;
f) dementia of any etiology;
g) inability to understand the study information presented;
h) regular drug administration for the treatment of noninfectious diseases excluding situations where disease is not in the exclusion criteria;
i) infectious disease or acute respiratory viral infection diagnosed during the study, infectious disease diagnosed at the moment of study entry or during the four-week period before the screening;
j) being blood transfusion recipient during the twelve-month period before the moment of study entry.
The extraction of cfDNA from plasma, sample preparation, cfDNA sequencing and bioinformatic processing of sequencing data have been performed as in Meshkov et al., 2024 .
The bioinformatic processing resulted in the data array containing fragmentome characteristics in the genome-wide scale for each apparently healthy subject. For further cfDNA data processing genome has been divided into 26460 non-overlapping intervals, each 100,000 bp in length. The intervaling was the same for all study participants. The sequenced cfDNA fragments have been mapped to these intervals and the length of each fragment has been estimated. Our study covered cfDNA fragments of length from 100 bp to 220 bp. The fragments of length of 100 – 150 and 151 – 220 bp have been considered as short and long respectively.
The total absolute number of cfDNA fragments (nf_absi), the absolute numbers of short and long fragments (sh_absi and long_absi respectively) have been calculated for each interval i.
These initial variables have been used to calculate relative characteristics of fragmentome that have been used subsequently:
– cfDNA fragment abundance has been calculated as logarithm of ratio between the total absolute number of cfDNA fragments mapped to the interval i and genome-wide mean of total absolute number of cfDNA fragments calculated across all intervals;
– the abundances of short and long fragments have been calculated according the same formulae;
where i = 1, …, 26440 is the interval index, log is the natural logarithm, sh_absi and long_absi are the absolute numbers of short and long cfDNA fragments mapped to the interval i.
– logarithm of the ratio of the number of short fragments to the number of long fragments:
– frequency of short fragments occurrence in the genomic range of interval i in logarithmic form:
– frequency of long fragments occurrence in the genomic range of interval i in logarithmic form:
A situation is possible when fragments are very low in numbers or even absent in a particular genomic interval. In such instance, the aforementioned relative fragmentome characteristics can increase or decrease to positive or negative infinite values respectively so it was decided to limit the resulting values to the range from -10 to +10.
The characteristics of the distribution of fragment lengths were assessed for each genomic interval i: mean, standard deviation, skewness and kurtosis.
The combination of methods of machine learning and statistical analysis has been used to reveal the genomic intervals characterized by age-associated variability of fragmentome characteristics. The fragmentome data processing has been performed in the genomic range of certain interval as follows: detection and cleaning of multivariate outliers, dimensionality reduction using principal component analysis , fitting a linear regression model, performing a F-test to verify whether any of the independent variables in a linear model are significant. Therefore, the statistical hypothesis has been checked for each genomic interval using F-test and respective p-value has been calculated. The obtained p-values have been adjusted by the Benjamini-Yekutieli procedure to control false discovery rate.
The adjusted p-value < 0,001 indicates that at least one of studied fragmentome characteristics in the genomic range of interest is age-associated. The genomic intervals with corresponding p-values > 0,001 have been excluded from further consideration.
To visualize study results on the plot the adjusted p-values have been transformed according to the formula:
where log10 — decimal logarithm;
adj_pval — adjusted p-value;
neglogpa — transformed adjusted p-value.
Kruskal-Wallis test and Conover post hoc test have been used to reveal the genomic intervals characterized by age-associated variability of relative number of cfDNA fragments (i. e. fragment abundance). For this purpose, the age variable has been transformed from quantitative to ordinal which levels are correspond to 5-year age ranges (Table 1). Each level of ordinal variable covers the group of patients with age values close to each other hereby creating samples to be compared by the value of cfDNA fragment abundance.
The size of each age comparison group
Age range (years) | Number of subjects within the age range |
20 – 24 | 17 |
25 – 29 | 13 |
30 – 34 | 8 |
35 – 39 | 9 |
40 – 44 | 33 |
45 – 50 | 18 |
50 – 54 | 30 |
55 – 59 | 45 |
60 – 64 | 57 |
65 – 69 | 49 |
70 – 74 | 46 |
75 – 78 | 21 |
All subjects (20 – 78) | 346 |
The p-values obtained by Kruskal-Wallis test and subsequent post hoc Conover test have been adjusted by the Benjamini-Yekutieli procedure. Existence of age-associated variability of cfDNA fragment abundance in the genomic range of interval has been proved if at least one Conover test p-value yielded level < 0,05.
The set of genomic intervals characterized by proven statistically significant age-associated variability of cfDNA fragment abundance have been filtered to create three subsets of genomic intervals. Each subset covers genomic intervals characterized by marked differences by cfDNA fragment abundance values observed between subjects of certain age groups and all the rest. According to the post hoc test results we created:
1) subset of genomic intervals with the most marked differences by cfDNA abundance values between subjects aged 20–29 years and subjects from the rest groups;
2) subset of genomic intervals with the most marked differences by cfDNA abundance between subjects aged 70–78 years and all the rest;
3) subset of genomic intervals with the most marked differences by cfDNA abundance between subjects aged 40–54 years and all the rest.
The genomic interval has been allocated to the first subset if we observed totally ≥ 5 statistically significant differences between two groups containing subjects aged 20–29 years and any other age groups. By the same way the genomic interval has been allocated to the second or to the third subset, the comparison groups contained subjects aged 70–78 years or 40–54 years respectively and the allocation was performed in the case of totally ≥ 5 statistically significant differences observed between comparison groups and any other age groups. We have created non-overlapping subsets.
Biological annotation of the identified genomic intervals was performed using bioinformatics tools such as the R annotables package (v0.2.0 Ensemble 109) to identify protein-coding genes within the intervals, the portal DISEASES to search for gene-disease associations and the voyAGEr web tool , which contains public data from the Gene Tissue Expression Consortium (GTEx v7 RNA-seq), based on which it predicts tissue-specific age-associated gene expression and its association with certain pathologies and conditions.
3. Results
The fragmentome data processing in the range on certain genomic interval has been performed for 26421 intervals of 26440. The rest 19 genomic intervals have been characterized by the absence or very low numbers of cfDNA fragments mapped (<10). For the majority of genomic intervals and with no regard to subject age the used sequencing depth resulted in the ranging of absolute amounts of mapped cfDNA fragments from 400 to 10 thousand.
The statistics of F-test and respective adjusted p-values have been calculated for 26421 genomic intervals. The distribution of adjusted p-values is shown in Fig 1.
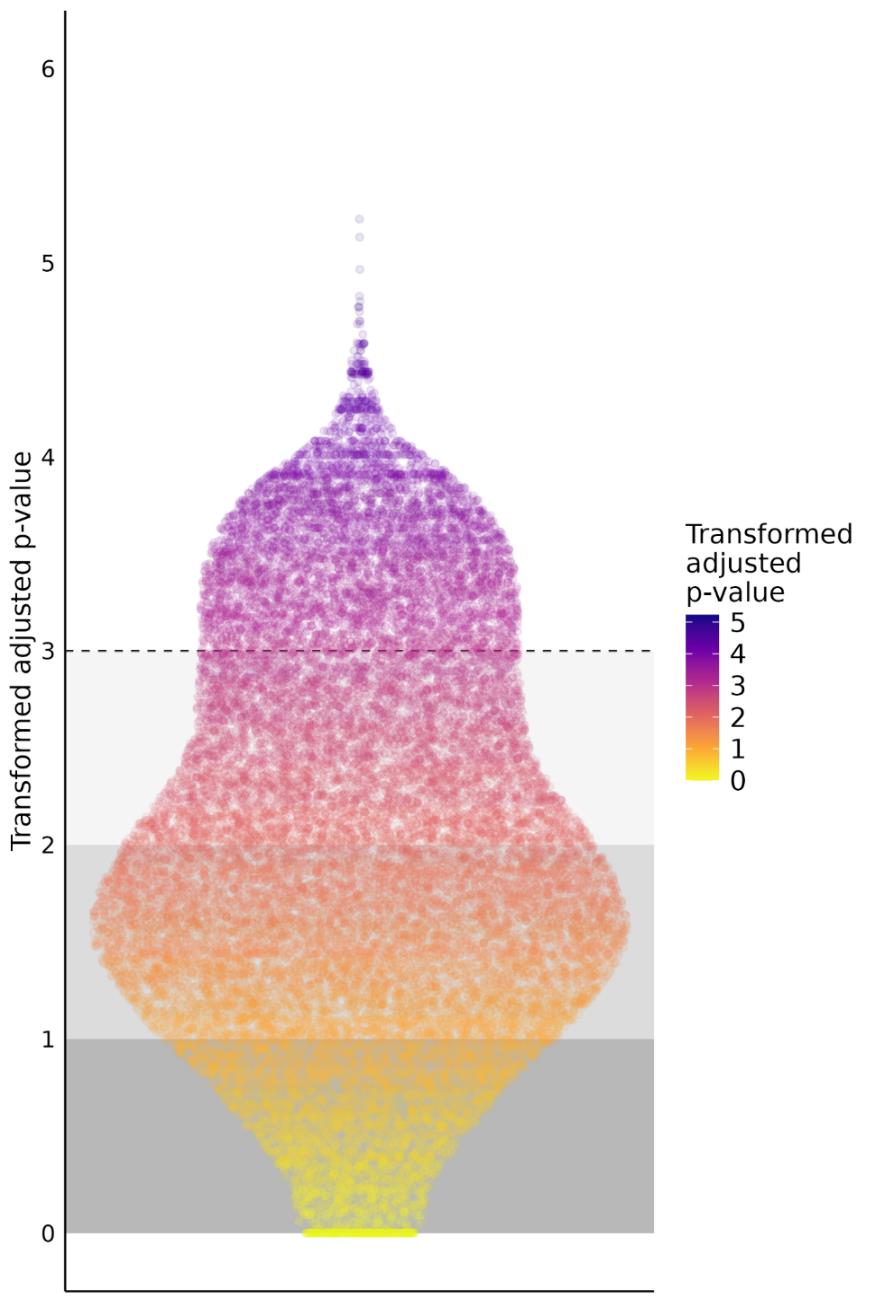
Results of the F-test applied to each genomic interval
the distribution of transformed adjusted p-values is presented. The dashed line corresponds to the initial adjusted p-value of 0.001. This limit value of 0,001 have been used for selection of genomic intervals
The set of 531 genomic intervals have been filtered to the size of 43 intervals and divided into three subsets containing 5, 23 and 15 genomic intervals respectively.
The first subset contains intervals characterized by marked and statisitcally significant differences by cfDNA fragment abundance between subjects aged 20–29 years and subjects of other age groups (Table 2).
The first subset of genomic intervals
№ of the interval | Chromosome | The interval beginning | The interval ending |
1 | 1 | 19973507 | 20073507 |
2 | 1 | 100234444 | 100334444 |
3 | 5 | 13999891 | 14099891 |
4 | 5 | 81804181 | 81904181 |
5 | 13 | 26425863 | 26525863 |
The second subset contains intervals characterized by marked and statisitcally significant differences by cfDNA fragment abundance between subjects aged 70–78 years and subjects of other age groups (Table 3). The genomic intervals allocated to the first and second subsets characterized by increasing or decline in cfDNA fragment abundance in the course of ageing and subsequent senescence. The observed trends are not monotonic but have been registered in each genomic interval of first and second subset without exceptions and can be traced from the youngest to the oldest age groups (Fig. 2, 3).
The second subset of genomic intervals
№ of the interval | Chromosome | The interval beginning | The interval ending |
6 | 1 | 68934317 | 69034317 |
7 | 2 | 194835276 | 194935276 |
8 | 2 | 209835276 | 209935276 |
9 | 3 | 153682211 | 153782211 |
10 | 4 | 161278848 | 161378848 |
11 | 5 | 25099891 | 25199891 |
12 | 5 | 99164296 | 99264296 |
13 | 6 | 58173722 | 58273722 |
14 | 6 | 81590283 | 81690283 |
15 | 6 | 127978855 | 128078855 |
16 | 7 | 45860401 | 45960401 |
17 | 7 | 50832303 | 50932303 |
18 | 8 | 28842483 | 28942483 |
19 | 8 | 132787754 | 132887755 |
20 | 9 | 90937718 | 91037718 |
21 | 10 | 85940243 | 86040243 |
22 | 11 | 85588956 | 85688957 |
23 | 12 | 83806221 | 83906221 |
24 | 13 | 61125866 | 61225867 |
25 | 15 | 36007799 | 36107799 |
26 | 18 | 7500002 | 7600002 |
27 | 18 | 12300001 | 12400001 |
28 | 19 | 30809093 | 30909093 |
The third subset contains intervals characterized by marked and statisitcally significant differences by cfDNA fragment abundance between subjects aged 40–54 years and subjects of other age groups (Table 4). These genomic intervals share the same peculiarity that is subjects aged 45–49 years significantly differ by the values of cfDNA fragment abundance from the older but not from the younger groups (Fig. 4).
The third subset of genomic intervals
№ of the interval | Chromosome | The interval beginning | The interval ending |
29 | 1 | 12740043 | 12840147 |
30 | 1 | 28973488 | 29073488 |
31 | 2 | 187535273 | 187635273 |
32 | 4 | 10198376 | 10298376 |
33 | 9 | 85385085 | 85485085 |
34 | 11 | 62232528 | 62332528 |
35 | 12 | 31547066 | 31647066 |
36 | 15 | 34407799 | 34507799 |
37 | 16 | 19988678 | 20088678 |
38 | 16 | 51266089 | 51366089 |
39 | 17 | 11496683 | 11596683 |
40 | 17 | 11796683 | 11896683 |
41 | 19 | 20817194 | 20917194 |
42 | 20 | 23819363 | 23919363 |
43 | 20 | 42771360 | 42871360 |
The distribution of 43 intervals across the genome is relatively uniform, and no bias towards certain chromosomes or their regions is observed. Annotation of 43 genomic intervals using the R annotables package (v0.2.0 Ensemble 109) yielded 42 protein-coding genes (Table 5), for which annotations according to the data from the DISEASES portal and the voyAGEr web tool were considered (Fig. 2–4) , . The DISEASES portal contains gene-disease associations, and voyAGEr contains public data from the Gene Tissue Expression Consortium (GTEx v7 RNA-seq), from which it makes predictions for each individual gene regarding its tissue-specific age-associated expression associated with specific conditions and pathologies. The results of the described associations for genes from each of the three subsets are presented in Figures 5–7 in Additional materials.
List of protein-coding genes within genomic intervals with age-associated changes in cfDNA characteristics
the results yielded by R annotables package (v0.2.0 Ensemble 109)
Subset | № of the interval | Gene | Original full name (HGNC) |
1 | 1 | PLA2G5 | phospholipase A2 group V |
1 | PLA2G2A | phospholipase A2 group IIA | |
2 | DBT | dihydrolipoamide branched chain transacylase E2 | |
2 | RTCA | RNA 3'-terminal phosphate cyclase | |
3 | DNAH5 | dynein axonemal heavy chain 5 | |
2 | 8 | UNC80 | unc-80 homolog, NALCN channel complex subunit |
14 | TENT5A | terminal nucleotidyltransferase 5A | |
15 | PTPRK | protein tyrosine phosphatase receptor type K | |
16 | IGFBP3 | insulin like growth factor binding protein 3 | |
16 | IGFBP1 | insulin like growth factor binding protein 1 | |
16 | CCDC201 | coiled-coil domain containing 201 | |
18 | INTS9 | integrator complex subunit 9 | |
18 | HMBOX1 | homeobox containing 1 | |
19 | TG | thyroglobulin | |
19 | PHF20L1 | PHD finger protein 20 like 1 | |
21 | GRID1 | glutamate ionotropic receptor delta type subunit 1 | |
22 | CREBZF | CREB/ATF bZIP transcription factor | |
22 | DLG2 | discs large MAGUK scaffold protein 2 | |
22 | TMEM126A | transmembrane protein 126A | |
22 | TMEM126B | transmembrane protein 126B | |
22 | CCDC89 | coiled-coil domain containing 89 | |
26 | PTPRM | protein tyrosine phosphatase receptor type M | |
27 | AFG3L2 | AFG3 like matrix AAA peptidase subunit 2 | |
27 | TUBB6 | tubulin beta 6 class V | |
3 | 29 | PRAMEF1 | PRAME family member 1 |
29 | PRAMEF12 | PRAME family member 12 | |
29 | CFAP107 | cilia and flagella associated protein 107 | |
29 | PRAMEF11 | PRAME family member 11 | |
30 | EPB41 | erythrocyte membrane protein band 4.1 | |
31 | TFPI | tissue factor pathway inhibitor | |
34 | SCGB2A2 | secretoglobin family 2A member 2 | |
34 | SCGB1D2 | secretoglobin family 1D member 2 | |
34 | SCGB1D4 | secretoglobin family 1D member 4 | |
35 | DENND5B | DENN domain containing 5B | |
35 | AK4P3 | adenylate kinase 4 pseudogene 3 | |
36 | GOLGA8A | golgin A8 family member A | |
37 | GPR139 | G protein-coupled receptor 139 | |
39 | SHISA6 | shisa family member 6 | |
40 | DNAH9 | dynein axonemal heavy chain 9 | |
42 | CST5 | cystatin D | |
42 | CST2 | cystatin SA | |
43 | PTPRT | protein tyrosine phosphatase receptor type T |
4. Discussion
Extracellular DNA is consisted of nuclear and mitochondrial fractions. The majority of research is focused on characteristics of nuclear fraction.
The early studies on changes in characteristics of cfDNA during the ageing process have been performed in the first decade of XXI century but the interest to this line of research has increased over the last five years. These studies have been performed with different degree of details, from estimating the cfDNA concentration in the several age groups to the genome-wide assessment of age-associated cfDNA fragmentation profiles.
A few reference sources have pointed out higher levels of both nuclear and mitochondrial cfDNA fractions in subjects of older age groups . The study performed by Jylhävä and coauthors shown that subjects aged ≥ 90 years have higher cfDNA plasma levels compared to the subjects aged 22–37 years . In the later research Meddeb and coauthors assessed concentration of nuclear and mitochondrial extracellular DNA in the group of 104 healthy subjects . Authors have found that approximately 50,000-fold more mitochondrial than nuclear genome copies is presented in the plasma of healthy individuals. The studied cohort have been divided into two subgroups, older (>47 years) and younger (<47 years) respectively. The concentration of nuclear cfDNA was higher in the subgroup of older subjects but there were no significant differences in the levels of mitochondrial cfDNA. At the same time, there have been published studies that did not show an increase in the content of cfDNA in the course of ageing. Thus, in the study by Alghofaili and coauthors involving 275 people aged 0–57 years, no increase in the concentration of cfDNA has been found in the older subjects. The discrepancy with the data presented above can be explained by the fact that in the work of Alghofaili and coauthors there were no subjects aged over 60 years .
Other characteristics of cfDNA that change with age are the mean fragment length and the distribution of fragment lengths in general. Fragments of cfDNA between 100 and 220 bp in length are produced predominantly during apoptosis, large fragments longer than 1000 bp are originated as a result of necrosis , . Cristiano and coauthors have shown that the distribution of cfDNA fragments in subjects older than 70 years of age is shifted towards shorter fragments compared to subjects younger than 40 years of age .
Shtumpf and coauthors developed a machine learning model that predicts age based on cfDNA fragmentation profiles. The authors explored datasets from several previous researches that have utilized cfDNA deep sequencing and found that the average distance between the centers of neighboring nucleosomes calculated over the entire genome, increases with the age of the subject. Within each individual fragmentome, they estimated the distribution of cаDNA fragment lengths and the distribution of distances between neighboring nucleosomes also considering genome-wide information on the mutual location of dinucleosomes and trinucleosomes. Using this knowledge, the authors have fitted a linear regression model with excellent predictive performance, with median absolute error values ranging from 3 to 3.5 years shown on the external dataset .
The present study has been performed with an intermediate degree of details as we have not considered genomic regions that correspond to large genomic or chromosomal structures nor we have explored genomic locations less than several thousand bp in size. Instead, using the genomic intervals of 100,000 bp in length we have ascertained that such fragmentomic characteristics as cfDNA fragment abundance or the distribution of cfDNA length are statistically significantly changed in the course of ageing at the genome-wide scale. These changes are most pronounced at certain genomic intervals, and they can also be particularly noticeable between certain age groups.
The abundance of genomic regions with cfDNA fragments probably reflects the intensity of transcription at these regions. However, this relationship between the fragmentome and the level of gene expression is realized in one way in extensive genomic regions of 100,000 bp or more and in a completely different way within a few hundred bp on either side of transcription start and end sites.
The indirect confirmation that the most of the cfDNA originates from euchromatin but not from heterochromatin regions has been obtained in a paper by Teo and coauthors. Three subjects between 20 and 30 years of age, three subjects from the 70-year age group, and six subjects over 100 years of age were included in the study. Of the latter group, three subjects aged more than 100 years were conventionally healthy, and another three subjects were bedridden patients. The authors divided the entire genome into 5 subcompartments that differed among themselves in terms of histone modifications. Subcompartments A1 and A2 corresponded to the euchromatin regions, subcompartment B1 corresponded to the regions of facultative heterochromatin, and subcompartments B2 and B3 corresponded to the predominantly constitutive heterochromatin regions. In all subjects aged 20–70 years, as well as in three healthy conditionally healthy centenarians, a greater saturation of cfDNA fragments was found in subcompartments A1 and A2 compared to subcompartment B3 .
A closer view at the regions of the genome where active transcription occurs reveals a different picture. Within these regions near transcription start sites, the position of nucleosomes can be determined with relatively high accuracy, and DNA fragmentation occurs in a nonrandom manner. Only those DNA regions protected by histones are released into the extracellular space, while other DNA regions are exposed to endonucleases and subjected to the rapid cleavage . According to the results of deep targeted sequencing of the fragmentome, a periodic rise and fall in the number of mapped cfDNA fragments is observed with the distance from the transcription start sites , .
The limitation of current research is that we have not performed specific assessment of chromatin topology and nucleosome localization signals. At the present stage of research, the interpretation of possible age-associated variations in the fragmentome characteristics has been focused to identify the genes lying in the intervals where we revealed the most pronounced age-associated changes in cfDNA fragments abundance. Using bioinformatic tools, we compared the age-associated changes in cfDNA fragment abundance with the prediction results for age-associated changes in the expression of genes located in these intervals. Based on the interpretation of the results of this comparative analysis, we identified several interesting patterns.
For example, the PLA2G2A gene located at interval №1 is statistically significantly associated with atherosclerosis. Indeed, knockout of the PLA2G2A gene in mouse models of atherosclerosis reduces the volume of atherosclerotic plaques, and active expression of PLA2G2A by human vascular fibroblasts has been detected, which contributed to plaque progression. At the same time, the results of voyAGEr analysis predict the existence of significant age-associated changes in PLA2G2A expression level in tissues of different organ systems, and the age-associated tissue-specific expression of PLA2G2A gene is associated with the state of chronic respiratory disease. This is supported by the function of the protein encoded by the PLA2G2A gene, PLA2. PLA2 is a Ca2+-dependent phospholipase 2A that plays a role in inflammation and fibrosis, among other things. PLA2G2A expression has also been shown to be associated with idiopathic pulmonary fibrosis, which is a chronic lung disease with a very poor prognosis , . Based on the fact that on this interval we see a decrease in cfDNA fragmentation with age, we can make an assumption that the different direction of change in cfDNA fragmentation of interval #1 and predicted expression of PLA2G2A gene from this interval may indicate that the relationship between transcription and fragmentation on this section of the genome is not direct, but reversed, and fragmentation may occur in less transcriptionally active DNA regions protected by histones .
Among the many relations between pathologies, tissue-specific and age-associated gene expression changes that have been found one may note the association of TFPI gene with coronary heart disease (CHD) should be especially noted. These associations have been identified by both DISEASES portal data and voyager interface prediction. The product of TFPI gene possesses antithrombotic effects and regulates the tissue factor-dependent clotting pathway. It has been found that patients with CHD have an increased level of TFPI compared to healthy subjects, also a negative correlation of TFPI level with the content of vitamins C, E and beta-carotene has been revealed . The gene is located in the interval № 31 and the latter has been allocated to the 3rd subset. The cfDNA fragment abundance value within this interval increases in the course of ageing. At the same time, CHD is a disease of older people and is significantly less common among subjects under 40 years of age. It can be assumed that in older people the expression of the TFPI gene increases, which positively affects the accessibility of the corresponding genome region for the action of endonucleases, which in turn leads to more intensive DNA fragmentation that has been detected in the present study.
Among the genes located in the intervals of the 2nd and 3rd subsets, there were three genes encoding protein-tyrosine phosphatases, PTPRM, PTPRK, and PTPRT. All three protein-tyrosine phosphatases belong to the same R2B subfamily, are transmembrane proteins, and have similar domains in extracellular regions. In addition to the presence of similar elements in the protein sequence, members of this family of phosphatases play similar roles in cellular processes, in particular, participate in cell adhesion, development of the nervous system at early stages of ontogenesis, and have tumor-suppressor functions . According to voyAGEr data, PTPRM expression increases with age, at the same time, based on the results of our study, the intensity of fragmentation at the interval № 26, where this gene is located, decreases with age. The fact that in the subset of genomic intervals with the most pronounced age-associated changes in cfDNA fragmentation, we found the genes encoding representatives of the same subfamily of phosphatases, which are very similar to each other both structurally and functionally should be considered remarkable and worthy for further exploration.
There are several explanations for the observed discrepancies between DNA fragmentation levels and gene expression profiles described in the databases in different age groups. First, a gene may occupy some part of a 100,000-bp interval, and the proportion of these cfDNA fragments may be relatively small compared to the amount of other cfDNA fragments mapped on this genomic interval. Second, the change in gene expression as the living organism grows older may be tissue-specific. The pool of plasma cfDNA is generated by the destruction of cells from several tissues. For there to be a pronounced decrease in the cfDNA fragments abundance that are originated from a particular genomic region, the latter must switch to a heterochromatin state in multiple cells belonging to different tissues. A change in chromatin condensation at a particular genome region and, as a consequence, a change in the abundance of cfDNA fragments originating from cells of a particular tissue can be masked by an overlapping pool of cfDNA fragments from the same genome region but from other tissues. Thus, to improve the accuracy of comparison of expression profiles and changes in cfDNA fragmentation and to identify patterns, further studies should also assess the impact of chromatin state and take into account the implementation of tissue-specific transcriptional programs for the specific cases-subjects analyzed. Due to methodological limitations (inability to assess these profiles for all the subjects under study in all tissues of the organism or at least in a certain number of organ tissues involved in the pathogenesis of age-associated changes and diseases), it is advisable to complement the experimental design by the analysis of chromatin changes and expression profiles under certain studied conditions and diseases, which is the subject of further research.
5. Conclusion
The present research has shown that across many genomic regions there is a change in fragmentome characteristics in the course of ageing. We have found that within many genomic intervals there is an age-associated change in the cfDNA fragments abundance resulting from fragmentation of genomic DNA at these intervals. In addition, the results of the present study indicate on age-associated changes in the cfDNA fragments length distribution across many genomic intervals. The change in fragmentome characteristics is generalized, i.e., distributed throughout the genome and not gathered at individual genome regions. A certain limitation of this work is the search for and interpretation of possible relationships between changes in gene expression levels and DNA fragmentation based on the results of sequencing of cfDNA fragments only within the framework of several publicly available databases. Identification of these associations in experimental data is the subject of further research.